Useful floor space
Time series : HFund_2.2-EN.xls
| Statistical zones Statistical regions Districts |
Useful floor space | |||||
|---|---|---|---|---|---|---|
| Total | living floor space1 | service floor space | ||||
| In towns | In villages | In towns | In villages | In towns | In villages | |
| Total | 237 959 377 | 110 955 714 | 184 217 079 | 88 212 795 | 53 742 298 | 22 742 919 |
| North and South-East Bulgaria | 113 096 672 | 60 858 107 | 88 057 120 | 48 740 142 | 25 039 552 | 12 117 965 |
| North-West region | 22 010 167 | 18 332 075 | 17 247 708 | 15 063 221 | 4 762 459 | 3 268 854 |
| Vidin | 2 888 378 | 3 036 440 | 2 193 162 | 2 525 434 | 695 216 | 511 006 |
| Vratsa | 4 433 959 | 3 984 671 | 3 478 136 | 3 221 838 | 955 823 | 762 833 |
| Lovech | 3 721 187 | 3 612 660 | 3 029 639 | 3 045 631 | 691 548 | 567 029 |
| Montana | 3 974 593 | 3 291 863 | 3 144 078 | 2 696 131 | 830 515 | 595 732 |
| Pleven | 6 992 050 | 4 406 441 | 5 402 693 | 3 574 187 | 1 589 357 | 832 254 |
| North Central region | 22 356 317 | 14 415 556 | 17 071 666 | 11 297 504 | 5 284 651 | 3 118 052 |
| Veliko Tarnovo | 7 250 307 | 4 636 606 | 5 523 098 | 3 546 092 | 1 727 209 | 1 090 514 |
| Gabrovo | 4 147 093 | 2 043 707 | 3 159 993 | 1 615 826 | 987 100 | 427 881 |
| Razgrad | 2 335 300 | 2 461 919 | 1 738 751 | 1 947 774 | 596 549 | 514 145 |
| Ruse | 6 452 866 | 2 677 679 | 5 012 554 | 2 158 723 | 1 440 312 | 518 956 |
| Silistra | 2 170 751 | 2 595 645 | 1 637 270 | 2 029 089 | 533 481 | 566 556 |
| North-East region | 31 241 972 | 12 385 720 | 23 880 354 | 9 769 802 | 7 361 618 | 2 615 918 |
| Varna | 18 727 707 | 4 119 412 | 14 332 759 | 3 203 710 | 4 394 948 | 915 702 |
| Dobrich | 5 288 537 | 3 069 862 | 3 994 858 | 2 471 137 | 1 293 679 | 598 725 |
| Targovishte | 2 819 093 | 2 419 306 | 2 205 079 | 1 924 941 | 614 014 | 494 365 |
| Shumen | 4 406 635 | 2 777 140 | 3 347 658 | 2 170 014 | 1 058 977 | 607 126 |
| South-East region | 37 488 216 | 15 724 756 | 29 857 392 | 12 609 615 | 7 630 824 | 3 115 141 |
| Burgas | 19 361 008 | 5 883 677 | 15 561 501 | 4 767 025 | 3 799 507 | 1 116 652 |
| Sliven | 5 087 466 | 2 673 734 | 4 024 416 | 2 114 201 | 1 063 050 | 559 533 |
| Stara Zagora | 9 670 660 | 5 123 875 | 7 606 450 | 4 064 620 | 2 064 210 | 1 059 255 |
| Yambol | 3 369 082 | 2 043 470 | 2 665 025 | 1 663 769 | 704 057 | 379 701 |
| South-West and South Central Bulgaria | 124 862 705 | 50 097 607 | 96 159 959 | 39 472 653 | 28 702 746 | 10 624 954 |
| South-West region | 82 897 108 | 25 586 754 | 63 491 269 | 20 421 819 | 19 405 839 | 5 164 935 |
| Blagoevgrad | 9 009 072 | 5 807 809 | 7 300 745 | 4 683 135 | 1 708 327 | 1 124 674 |
| Kyustendil | 4 102 568 | 3 295 834 | 3 255 789 | 2 731 094 | 846 779 | 564 740 |
| Pernik | 4 017 017 | 3 337 150 | 3 071 489 | 2 706 384 | 945 528 | 630 766 |
| Sofia | 6 362 256 | 8 051 599 | 5 015 254 | 6 546 311 | 1 347 002 | 1 505 288 |
| Sofia cap. | 59 406 195 | 5 094 362 | 44 847 992 | 3 754 895 | 14 558 203 | 1 339 467 |
| South Central region | 41 965 597 | 24 510 853 | 32 668 690 | 19 050 834 | 9 296 907 | 5 460 019 |
| Kardzhali | 3 254 679 | 4 358 516 | 2 569 029 | 3 400 058 | 685 650 | 958 458 |
| Pazardzhik | 7 044 421 | 4 329 817 | 5 545 272 | 3 476 260 | 1 499 149 | 853 557 |
| Plovdiv | 21 284 207 | 8 872 682 | 16 594 695 | 6 982 407 | 4 689 512 | 1 890 275 |
| Smolyan | 3 133 798 | 3 334 667 | 2 313 021 | 2 364 337 | 820 777 | 970 330 |
| Haskovo | 7 248 492 | 3 615 171 | 5 646 673 | 2 827 772 | 1 601 819 | 787 399 |
1 Living floor space includes the space of the kitchens over 4 sq. m |
||||||
29.07.2024
| Contact | |
|---|---|
| Contact organisation | National Statistical Institute |
| Contact organisation unit | Population and Housing Fund Statistics |
| Contact name | Kameliya Blagoeva |
| Contact person function | Chief expert |
| Contact mail address | 2, P. Volov Str.; 1038 Sofia, Bulgaria |
| Contact email address | |
| Contact phone number | +359 2 9857 205 |
| Contact fax number | |
| Metadata update | |
| Metadata last certified | 28 July 2023 |
| Metadata last posted | 28 July 2023 |
| Metadata last update | 28 July 2023 |
| Statistical presentation | |
| Data description | Dwellings by number of the rooms, type of settlement (town, village), useful floor space by type of settlement (town, village). |
| Classification system | · Classification of Territorial Units for Statistical Purposes in Bulgaria (NUTS); · Unified Classification of the Administrative-Territorial and Territorial Units in Bulgaria (UCATTU). |
| Sector coverage | The survey covers all residential buildings and dwellings in the country. |
| Statistical concepts and definitions | Residential buildings are the buildings which by initial building or after reconstruction are suitable for living and consists of one or more dwellings which take at least 60% from the total area. In the coverage of the survey ”Housing fund at the end of the year” are included inhabited and uninhabited residential buildings, campuses and buildings of institutional households. Residential building are divided into following types:
The dwelling is separate and independent in the terms of construction place, which by initial building or after reconstruction is suitable for living, has one or several rooms (housing or service) and has one or several separate exits to a generally accessible part (stairs, yard or straight to the street), irrespective of whether a kitchen has been built. A dwelling which is situated on two or three floors in one residential building where live one household is counted as one dwelling. However, each floor is counted as a separate dwelling if separate household lives on each floor. The rooms in the hotel type constructions (hall system) in which live separate households are counted as separate dwellings. All rooms and services in the buildings in which are accommodated people from the joint household (boarding-houses, specialized homes, cloisters, prisons, etc) form one dwelling place. Living floor space includes the space of the rooms and kitchens over 4 sq. m. floor area. Тhe space of the kitchens with over 4 sq. m floor area was presented separately before 31.12.2018. A room is defined as a space in the dwelling enclosed by walls reaching from the floor to the ceiling or roof, of a size large enough to hold a bed for an adult (4 sq. meters at least) and at least 2 meters high over the major area of the ceiling. Service floor space is the floor area of the rooms and kitchens with less than 4 square meters floor area, vestibules with a portal or an other screen, corridors, bathrooms, toilets, larders, hanging closets, other service rooms such as drying-rooms, laundries or balconies not depending on their area. The useful floor space of the dwelling is sum of the living-floor-space and service floor space. The living-floor-space per capita is calculated on the base of the number of the population at the end of the year. The data about the residential buildings and the dwellings in them are presented according to the administrative division of Bulgaria as of 31.12. of the reference year. The data of the housing fund as of 31.12. is obtained on the basis of results from the last conducted Census of housing fund and to them every year is added the number of newly constructed residential buildings and dwellings and are taken out destroyed during the reference year. |
| Statistical unit | The object of the survey are the residential buildings and the dwellings in residential buildings in the country. |
| Statistical population | The statistical survey on Housing fund is exhaustive - the residential buildings and the dwellings in residential buildings in the country. |
| Reference area | The Republic of Bulgaria's territory. |
| Time coverage | 2004-2022 |
| Base period | Not applicable. |
| Unit of measure | |
Number, Square meter. | |
| Reference period | |
Year | |
| Institutional mandate | |
| Legal acts and other agreements | Not applicable. |
| Data sharing | Not applicable. |
| Confidentiality | |
| Confidentiality - policy | · Law on Statistics; · Regulation (EC) No 223/2009 on European statistics (recital 24 and Article 20(4)) of 11 March 2009 (OJ L 87, p. 164), stipulates the need to establish common principles and guidelines ensuring the confidentiality of data used for the production of European statistics and the access to those confidential data with due account for technical developments and the requirements of users in a democratic society. |
| Confidentiality - data treatment | Individual data are not published in accordance with article 25 of the Law on Statistics. The publishing of individual data can be performed only in accordance with article 26 of the same law. |
| Release policy | |
| Release calendar | Statistical information is published according to the Release Calendar presenting the results of the statistical surveys carried out by the National Statistical Institute. Data for Housing fund is published on the NSI website annually, five months after the reference period. |
| Release calendar access | The calendar is available on the NSI website: https://www.nsi.bg/bg/node/488 |
| User access | Data is published on the NSI website, section Housing fund in accordance with the Law on Statistics and the European Statistics Code of Practice respecting the professional independence and aimed at objectivity, transparency and equal treatment of all consumers. |
| Frequency of dissemination | |
Annually | |
| Accessibility and clarity | |
| News release | Not applicable. |
| Publications | · Statistical Reference Book; · Statistical Yearbook; · Regions, districts and municipalities in the Republic of Bulgaria. |
| On-line database | Data on Dwellings and Useful floor space are available to all users of the NSI website under the heading Housing fund:https://www.nsi.bg/bg/node/3143 и в Информационна система Инфостат: https://infostat.nsi.bg/infostat/pages/external/login.jsf?lang=bg |
| Micro-data access | Anonymised individual data can be provide for scientific and research purposes, and for individual request according to the Rules for the provision of anonymised individual data for scientific and research purposes. |
| Other | Information service on request, according to the Rules for the dissemination of statistical products and services in NSI. |
| Documentation on methodology | Survey Methodology: https://www.nsi.bg/sites/default/files/files/metadata/HFund_2_Methodology_EN.pdf |
| Quality documentation | Not available. |
| Quality management | |
| Quality assurance | Not applicable. |
| Quality assessment | Not applicable. |
| Relevance | |
| User needs | Not applicable. |
| User satisfaction | Satisfaction survey among the users is not conducted. |
| Completeness | High level of completeness in accordance with the methodology. |
| Accuracy and reliability | |
| Overall accuracy | Not applicable. |
| Sampling error | Not applicable. |
| Non-sampling error | Not applicable. |
| Timeliness and punctuality | |
| Timeliness | Statistical data on housing fund is published annually, five months after the reference period. |
| Punctuality | Data are disseminated according to the ARC timelines. |
| Coherence and comparability | |
| Comparability - geographical | Data are prepared at national level. |
| Comparability - over time | Data are comparable. In order to ensure comparability of the data, for the space of kitchens from Census 2021, the space of kitchens was imputed for unoccupied dwellings and for dwellings with no specified one. There is a break in the dynamic series of housing fund data in 2011 and 2022. |
| Coherence - cross domain | Not applicable. |
| Coherence - internal | Not applicable. |
| Cost and burden | |
Not applicable. | |
| Data revision | |
| Data revision - policy | Not applicable. |
| Data revision - practice | Not applicable. |
| Statistical processing | |
| Source data | Data source of information for the Balance of housing fund as of 31.12. are data from the last conducted Census of housing fund, as well as a statistical form “Card for residential building”, which collects data for newly built and destroyed residential buildings and dwellings in the reference reporting year. |
| Frequency of data collection | Annually |
| Data collection | The Balance of the housing fund data as of 31.12. is obtained on the basis of results from the last conducted Census of housing fund and to them every year is added the number of newly constructed residential buildings and dwellings and are taken out destroyed during the reference year. |
| Data validation | Not applicable. |
| Data compilation | The data processing is centralized at the national level. |
| Adjustment | Not applicable. |
| Comment | |
Download in SDMX 2.1 file format: Housing fund - Dwellings, Useful floor space
Metadata Structure Definition in SDMX 2.1: ESMS_MSD+BNSI+2.0+SDMX.2.1.xml
Download in SDMX 2.0 file format: Housing fund - Dwellings, Useful floor space
Metadata Structure Definition in SDMX 2.0: ESMS_MSD+BNSI+2.0+SDMX.2.0.xml
Newly Built Residential Buildings and Dwellings Completed in the Fourth Quarter of 2024 (Preliminary Data)
According to the National Statistical Institute preliminary data, in the fourth quarter of 2024, the number of newly built residential buildings was 1 378, and the newly built dwellings in them were 5 192.
...Newly Built Residential Buildings and Dwellings Completed in the Third Quarter of 2024
According to preliminary data from the National Statistical Institute, in the third quarter of 2024, the number of newly built residential buildings was 1 177, and the newly built dwellings in them were 4 398.
In the third quarter of 2024, 73.2% of the newly built residential buildings had steel-concrete construction, 22.8% had solid structure, 3.1% had ‘other’ and 0.9% had a panel construction. The highest is the relative share of newly built houses (78.6%), followed by blocks of flats (14.4%).
The highest is the number of residential buildings built in Plovdi...
Newly Built Residential Buildings and Dwellings Completed in the Second Quarter of 2024 (Preliminary Data)
According to preliminary data[1] from the National Statistical Institute, in the second quarter of 2024, the number of newly built residential buildings was 1 039, and the newly built dwellings in them were 5 090.
In the second quarter of 2024, 77.1% of the newly built residential buildings had steel-concrete construction, 18.2% had solid structure, 4.0% had ‘other’ and 0.7% had a panel construction. The highest is the relative share of newly built houses (75.5%), followed by blocks of flats (16.0%).
The highe...
Newly Built Residential Buildings and Dwellings Completed in the First Quarter of 2024 (preliminary data)
According to preliminary data from the National Statistical Institute in the first quarter of 2024, the number of newly built residential buildings was 1 026, and the newly built dwellings in them were 3 475.
In the first quarter of 2024, 78.5% of the newly built residential buildings had steel-concrete construction, 16.0% had solid structure, 4.3% had ‘other’ and 1.2% had a panel construction. The highest is the relative share of houses (79.1%), followed by blocks of flats (12.9%).
The highest is the number of residential buildings built in the district of Plovdiv ...
Newly Built Residential Buildings and Dwellings Completed in the Fourth Quarter of 2023 (preliminary data)
According to preliminary data from the National Statistical Institute in the fourth quarter of 2023, the number of newly built residential buildings was 1 529, and the newly built dwellings in them were 6 350. Compared to the fourth quarter of 2022, the buildings were by 57 less (or by 3.6%), and the newly built dwellings in them increased by 1 101, or by 21.0%.
76.8% of the newly built residential buildings had steel-concrete construction, 19.5% had solid structure, 3.3% had ‘other’ and 0.4% had a panel. The highest is the relative share of houses (78.3%), followed by blocks...
Newly Built Residential Buildings and Dwellings Completed in the Third Quarter of 2023 (preliminary data)
According to preliminary data from the National Statistical Institute in the third quarter of 2023, the number of newly built residential buildings was 1 239, and the newly built dwellings in them were 5 085. Compared to the third quarter of 2022, the buildings were by 97 less (or by 7.3%), and the newly built dwellings in them decreased by 856, or 14.4%.
73.5% of the newly built residential buildings had steel-concrete construction, 23.3% had solid structure, 2.9% had ‘other’ and 0.3% had a panel. The highest is the relative share of houses (76.0%), followed by blocks o...
Newly Built Residential Buildings and Dwellings Completed in the Second Quarter of 2023 (preliminary data)
According to preliminary data from the National Statistical Institute in the second quarter of 2023, the number of newly built residential buildings was 1 180, and the newly built dwellings in them were 5 198. Compared to the second quarter of 2022, the buildings were by 17 less (or by 1.4%), and the newly built dwellings in them increased by 1 121 more, or 27.5%.
75.3% of the newly built residential buildings had steel-concrete construction, 20.9% had solid structure, 3.6% had ‘other’ and 0.2% had a panel. The highest is the relative share of houses (78.7%), followed by blocks of...
Newly Built Residential Buildings and Dwellings Completed in the First Quarter of 2023 (preliminary data)
According to preliminary data from the National Statistical Institute in the first quarter of 2023, the number of newly built residential buildings was 1 289, and the newly built dwellings in them were 4 427. Compared to the first quarter of 2022, the buildings were by 18 more (or by 1.4%), and the newly built dwellings in them decreased by 153, or by 3.3%.
...Newly Built Residential Buildings and Dwellings Completed in the Fourth Quarter of 2022 (preliminary data)
According to preliminary data from the National Statistical Institute in the fourth quarter of 2022, the number of newly built residential buildings was 1 613, and the newly built dwellings in them were 5 708. Compared to the fourth quarter of 2021, the buildings were by 392 more (or by 32.1%), and the newly built dwellings in them increased by 285, or by 5.3%.
In the fourth quarter of 2022, 78.9% of the newly built residential buildings had steel-concrete construction, 17.4% had solid structure, 3.4% had ‘other’ and 0.3% had a panel. The highest is the relative share of...
Newly Built Residential Buildings and Dwellings Completed in the Third Quarter of 2022 (preliminary data)
According to preliminary data of the National Statistical Institute in the third quarter of 2022, the number of newly built residential buildings was 1 316, and the newly built dwellings in them were 5 812. Compared to the third quarter of 2021, the buildings were by 458 more (or by 53.4%), and the newly built dwellings in them increased by 2 008, or by 52.8%.
In the third quarter of 2022, 78.7% of the newly built residential buildings had steel-concrete construction, 18.7% had solid structure, 2.1% had ‘other’ and 0.5% had a panel. The highest is the relative share...
Newly Built Residential Buildings and Dwellings Completed in the Second Quarter of 2022 (preliminary data)
According to preliminary data of the National Statistical Institute in the second quarter of 2022, the number of newly built residential buildings was 1 128, and the newly built dwellings in them were 3 826. Compared to the second quarter of 2021, the buildings were by 261 more (or by 30.1%), and the newly built dwellings in them decreased by 342, or by 8.2%.
...Newly Built Residential Buildings and Dwellings Completed in the First Quarter of 2022 (preliminary data)
According to preliminary data of the National Statistical Institute in the first quarter of 2022, the number of newly built residential buildings was 1 206, and the newly built dwellings in them were 4 299. Compared to the first quarter of 2021, the buildings were by 254 more (or by 26.7%), and the newly built dwellings in them decreased by 174, or by 3.9%.
...Newly Built Residential Buildings and Dwellings Completed in the Fourth Quarter of 2021 (preliminary data)
According to preliminary data of the National Statistical Institute in the fourth quarter of 2021, the number of newly built residential buildings was 1 329 and the newly built dwellings in them were 6 430. Compared to the fourth quarter of 2020 the buildings were by 401 more (or by 43.2%), and the newly built dwellings in them increased by 2 121 or by 49.2%.
...Newly Built Residential Buildings and Dwellings Completed in the Third Quarter of 2021 (preliminary data)
According to preliminary data of the National Statistical Institute in the third quarter of 2021, the number of newly built residential buildings was 838 and the newly built dwellings in them were 3 390. Compared to the third quarter of 2020 the buildings were by 61 less (or by 6.8%), and the newly built dwellings in them decreased by 533 or by 13.6%.
...Newly Built Residential Buildings and Dwellings Completed in the Second Quarter of 2021 (preliminary data)
According to preliminary data of the National Statistical Institute in the second quarter of 2021 the number of newly built residential buildings was 838 and the newly built dwellings in them were 4 058. Compared to the second quarter of 2020 the buildings were by 81 more (or by 10.7%) and the newly built dwellings in them increased by 678 or by 20.1%.
...Newly Built Residential Buildings and Dwellings Completed in the First Quarter of 2021 (preliminary data)
According to preliminary data of the National Statistical Institute in the first quarter of 2021 the number of newly built residential buildings was 925 and the newly built dwellings in them were 4 011. Compared to the first quarter of 2020 the buildings were by 133 more (or by 16.8%) and the newly built dwellings in them increased by 208 or by 5.5%.
...Newly Built Residential Buildings and Dwellings Completed in the Fourth Quarter of 2020 (preliminary data)
According to preliminary data of the National Statistical Institute in the fourth quarter of 2020 the number of newly built residential buildings was 969 and the newly built dwellings in them were 4 401. Compared to the fourth quarter of 2019 the buildings were by 32 more (or by 3.4%) and the newly built dwellings in them increased by 220 or by 5.3%.
...Newly Built Residential Buildings and Dwellings Completed in the Third Quarter of 2020 (preliminary data)
According to preliminary data of the National Statistical Institute in the third quarter of 2020 the number of newly built residential buildings was 879 and the newly built dwellings in them were 3 912. Compared to the third quarter of 2019 the buildings were by 91 more (or by 11.5%) and the newly built dwellings in them increased by 928 or by 31.1%.
...Newly Built Residential Buildings and Dwellings Completed in the Second Quarter of 2020 (preliminary data)
According to preliminary data of the National Statistical Institute in the second quarter of 2020 the number of newly built residential buildings was 766 and the newly built dwellings in them were 3 660. Compared to the second quarter of 2019 the buildings were by 104 more (or by 15.7%) and the newly built dwellings in them increased by 1 317 or by 56.2%.
...Newly Built Residential Buildings and Dwellings Completed in the First Quarter of 2020 (preliminary data)
According to preliminary data of the National Statistical Institute in the first quarter of 2020 the number of newly built residential buildings was 751 and the newly built dwellings in them were 3 473. Compared to the first quarter of 2019 the buildings were by 86 more (or by 12.9%) and the newly built dwellings in them increased by 876 or by 33.7%.
...Newly Built Residential Buildings and Dwellings Completed in the Fourth Quarter of 2019 (preliminary data)
According to preliminary data of the National Statistical Institute in the fourth quarter of 2019 the number of newly built residential buildings was 1 057 and the newly built dwellings in them were 4 474. Compared to the fourth quarter of 2018 the buildings were by 335 more (or by 46.4%) and the newly built dwellings in them increased by 2 101 or by 88.5%.
...Newly Built Residential Buildings and Dwellings Completed in the Third Quarter of 2019 (preliminary data)
According to preliminary data of the National Statistical Institute in the third quarter of 2019 the number of newly built residential buildings was 740 and the newly built dwellings in them were 2 892. Compared to the third quarter of 2018 the buildings were by 280 more (or by 60.9%) and the newly built dwellings in them increased by 948 or by 48.8%.
...Newly Built Residential Buildings and Dwellings Completed in the Second Quarter of 2019 (preliminary data)
According to preliminary data of the National Statistical Institute in the second quarter of 2019 the number of newly built residential buildings was 632 and the newly built dwellings in them were 2 250. Compared to the second quarter of 2018 the buildings were by 60 more (or by 10.5%) and the newly built dwellings in them decreased by 34 or by 1.5%.
...Newly Built Residential Buildings and Dwellings Completed in the First Quarter of 2019 (preliminary data)
According to preliminary data of the National Statistical Institute in the first quarter of 2019 the number of newly built residential buildings was 635 and the newly built dwellings in them were 2 453. Compared to the first quarter of 2018 the buildings were by 65 more (or by 11.4%) and the newly built dwellings in them increased by 918 or by 59.8%.
...Newly Built Residential Buildings and Dwellings Completed in the Fourth Quarter of 2018 (preliminary data)
According to preliminary data of the National Statistical Institute in the fourth quarter of 2018 the number of newly built residential buildings was 721 and the newly built dwellings in them were 2 345. Compared to the fourth quarter of 2017 the buildings were by 67 more (or by 10.2%) and the newly built dwellings in them increased by 304 or by 14.9%.
...Newly Built Residential Buildings and Dwellings Completed in the Third Quarter of 2018 (preliminary data)
According to preliminary data of the National Statistical Institute in the third quarter of 2018 the number of newly built residential buildings was 454 and the newly built dwellings in them were 1 944. Compared to the third quarter of 2017 the buildings were by 51 less (or by 10.1%) and the newly built dwellings in them decreased by 73 or by 3.6%.
...Newly Built Residential Buildings and Dwellings Completed in the Second Quarter of 2018 (preliminary data)
According to preliminary data of the National Statistical Institute in the second quarter of 2018 the number of newly built residential buildings was 573 and the newly built dwellings in them were 2 285. Compared to the second quarter of 2017 the buildings were by 11 less (or by 1.9%) and the newly built dwellings in them decreased by 290 or by 11.3%.
...Newly Built Residential Buildings and Dwellings Completed in the First Quarter of 2018 (preliminary data)
According to preliminary data of the National Statistical Institute in the first quarter of 2018 the number of newly built residential buildings was 565 and the newly built dwellings in them were 1 530. Compared to the first quarter of 2017 the buildings were by 103 more (or by 22.3%) while the newly built dwellings in them decreased by 221 or by 12.6%.
...Newly Built Residential Buildings and Dwellings Completed in the Fourth Quarter of 2017 (preliminary data)
According to preliminary data of the National Statistical Institute in the fourth quarter of 2017 the number of newly built residential buildings was 659 and the newly built dwellings in them were 2 046. Compared to the fourth quarter of 2016 the buildings were by 34 more (or by 5.4%) while the newly built dwellings in them decreased by 354 or by 14.8%.
...Newly Built Residential Buildings and Dwellings Completed in the Third Quarter of 2017 (preliminary data)
According to preliminary data of the National Statistical Institute in the third quarter of 2017 the number of newly built residential buildings was 506 and the newly built dwellings in them were 2 018. Compared to the third quarter of 2016 the buildings were by 30 more (or by 6.3%) while the newly built dwellings in them decreased by 361 or by 15.2%.
...Newly Built Residential Buildings and Dwellings Completed in the Second Quarter of 2017 (preliminary data)
According to preliminary data of the National Statistical Institute in the second quarter of 2017 the number of newly built residential buildings was 585 and the newly built dwellings in them were 2 576. Compared to the second quarter of 2016 the buildings were by 66 more (or 12.7%) and the newly built dwellings in them increased by 323 or by 14.3%.
...Newly Built Residential Buildings and Dwellings Completed in the First Quarter of 2017 (preliminary data)
According to preliminary data of the National Statistical Institute in the first quarter of 2017 the number of newly built residential buildings was 462 and the newly built dwellings in them were 1 751. Compared to the first quarter of 2016 the buildings were by 79 or 14.6% less and the newly built dwellings in them decreased by 559 or by 24.2.%.
...Newly Built Residential Buildings and Dwellings Completed in the Fourth Quarter of 2016 (preliminary data)
According to preliminary data of the National Statistical Institute in the fourth quarter of 2016 the number of newly built residential buildings was 634 and the newly built dwellings in them were 2 451. Compared to the fourth quarter of 2015 the buildings were 2 more (or 0.3%), and the newly built dwellings in them increased by 455 or by 22.8%.
...Newly Built Residential Buildings and Dwellings Completed in the Third Quarter of 2016 (preliminary data)
According to preliminary data of the National Statistical Institute in the third quarter of 2016 the number of newly built residential buildings was 476 and the newly built dwellings in them were 2 379. Compared to the third quarter of 2015 the buildings were 101 less (or 17.5%), and the newly built dwellings in them decreased by 77 or by 3.1%.
...Newly Built Residential Buildings and Dwellings Completed in the Second Quarter of 2016 (preliminary data)
According to preliminary data of the National Statistical Institute in the second quarter of 2016 the number of newly built residential buildings was 521 and the newly built dwellings in them were 2 248. Compared to the second quarter of 2015 the buildings were by 16 more (or 3.2%) and the newly built dwellings in them increased by 303 or by 15.6%.
...Newly Built Residential Buildings and Dwellings Completed in the First Quarter of 2016 (preliminary data)
According to preliminary data of the National Statistical Institute in the first quarter of 2016 the number of newly built residential buildings was 543 and the newly built dwellings in them were 2 291. Compared to the fourth quarter of 2015 the buildings were by 6 less (or 1.1%) while the newly built dwellings in them increased by 882 or by 62.6%.
...Statistical Reference Book 2024

Тhe National Statistical Institute presents to the users of statistical information the annual publication - Statistical Reference Book 2024 in English.
The Statistical Reference Book presents up-to-date information on the demographic processes as well as the economic, social and cultural development of the Republic of Bulgaria for the 2019 - 2023 period.
The publication presents data on main macroeconomic indicators of the national economy - gross domestic product, investments and finance; and economic acti...
Statistical Reference Book 2024 (Bulgarian version)
The National Statistical Institute presents to users of statistical information the annual publication - Statistical Reference Book 2024 in Bulgarian.
The Statistical Reference Book presents up-to-date information on the demographic processes as well as the economic, social and cultural development of the Republic of Bulgaria for the 2019 - 2023 period.
The publication presents data on main macroeconomic indicators of the national economy - gross domestic product, investments and finance; and economic activity groupings - industry, agriculture, forestry,...
Statistical Yearbook 2023
The National Statistical Institute (NSI) has the pleasure to present to the attention of national and foreign users of statistical information the 91-st edition of the ‘Statistical Yearbook of the Republic of Bulgaria’ in printed format.
It provides current statistical information about the demographic, economic and social development of the country for 2017 - 2022 in different territorial and classification aggregations and breakdowns.
According to the Law on Statistics, official source of information in the Republic of Bulgaria is the National Statistical Sys...
Statistical Reference Book 2023 (Bulgarian version)
The National Statistical Institute presents to users of statistical information the annual publication - Statistical Reference Book 2023 in Bulgarian.
The Statistical Reference Book presents topical information on the demographic processes as well as the economic, social and cultural development of the Republic of Bulgaria for the 2018 - 2022 period.
The publication presents data on main macroeconomic indicators of the national economy - gross domestic product, investments and finance; and economic activity groupings ...
Statistical Reference Book 2023
The National Statistical Institute presents to users of statistical information the annual publication - Statistical Reference Book 2023 in English.
The Statistical Reference Book presents topical information on the demographic processes as well as the economic, social and cultural development of the Republic of Bulgaria for the 2018 - 2022 period.
The publication presents data on main macroeconomic indicators of the national economy - gross domestic product, investments and finance; and economic activity groupings - industry, agriculture, fore...
Statistical Yearbook 2022
The National Statistical Institute (NSI) has the pleasure to present to the attention of national and foreign users of statistical information the 90th edition of the ‘Statistical Yearbook of the Republic of Bulgaria’ in printed format.
It provides current statistical information about the demographic, economic and social development of the country for 2016 - 2021 in different territorial and classification aggregations and breakdowns.
According to the Law on Statistics, official source of information in the Republic of Bulgaria is the National Statistical ...
Statistical Reference Book 2022
The National Statistical Institute presents to users of statistical information the annual publication - Statistical Reference Book 2022 in English.
The Statistical Reference Book presents topical information on the demographic processes as well as the economic, social and cultural development of the Republic of Bulgaria for the 2017 - 2021 period.
The publication presents data on main macroeconomic indicators of the national economy - gross domestic product, investments and finance; and economic activity groupings - industry, agriculture, ...
Statistical Reference Book 2022 (Bulgarian version)
The National Statistical Institute presents to users of statistical information the annual publication - Statistical Reference Book 2022 in Bulgarian.
The Statistical Reference Book presents topical information on the demographic processes as well as the economic, social and cultural development of the Republic of Bulgaria for the 2017 - 2021 period.
The publication presents data on main macroeconomic indicators of the national economy - gross domestic product, investments and finance; and economic activity groupings - industry, agriculture, fo...
Statistical Yearbook 2021
The National Statistical Institute (NSI) has the pleasure to present to the attention of national and foreign users of statistical information the 89th edition of the ‘Statistical Yearbook of the Republic of Bulgaria’ in printed and electronic format.
It provides current statistical information about the demographic, economic and social development of the country for 2015 - 2020 in different territorial and classification aggregations and breakdowns.
According to the Law on Statistics, official source of information in the Republic of Bulgaria is the ...
Statistical Reference Book 2021
The National Statistical Institute presents to users of statistical information the annual publication - Statistical Reference Book 2021 in English.
The Statistical Reference Book presents topical information on the demographic processes as well as the economic, social and cultural development of the Republic of Bulgaria for the 2016 - 2020 period.
The publication presents data on main macroeconomic indicators of the national economy - gross domestic product, investments and finance; and economic activity groupings - industry, agriculture, forestry, ...
Statistical Reference Book 2021 (Bulgarian version)

The National Statistical Institute presents to users of statistical information the annual publication - Statistical Reference Book 2021 in Bulgarian.
The Statistical Reference Book presents topical information on the demographic processes as well as the economic, social and cultural development of the Republic of Bulgaria for the 2016 - 2020 period.
The publication presents data on main macroeconomic indicators of the national economy - gross domestic product, investments and finance; and economic activity groupings - industry, agri...
Statistical Yearbook 2020
The National Statistical Institute (NSI) has the pleasure to present to the attention of national and foreign users of statistical information the 88th edition of the ‘Statistical Yearbook of the Republic of Bulgaria’ in printed and electronic format.
It provides current statistical information about the demographic, economic and social development of the country for 2014 - 2019 in different territorial and classification aggregations and breakdowns.
According to the Law on Statistics, official source of information in the Republic of Bulgaria is the ...
Statistical Yearbook 2012

The National Statistical Institute (NSI) has the pleasure to submit to the attention of national and foreign users of statistical information the 80th edition of the ‘Statistical Yearbook of the Republic of Bulgaria’ in printed and electronic format.
It provides current statistical information about the demographic, economic and social development of the country for the 2007 - 2011 period in different territorial and classification aggregations and breakdowns.
Accor...
Statistical Reference Book 2020
The National Statistical Institute presents to users of statistical information the annual publication - Statistical Reference Book 2020 in English.
The Statistical Reference Book presents topical information on the demographic processes as well as the economic, social and cultural development of the Republic of Bulgaria for the 2016 - 2019 period.
The publication presents data on main macroeconomic indicators of the national economy - gross domestic product, investments and finance; and economic activity groupings - industry, agriculture, forestry, ...
Statistical Reference Book 2020 (Bulgarian version)
The National Statistical Institute presents to users of statistical information the annual publication - Statistical Reference Book 2020 in Bulgarian.
The Statistical Reference Book presents topical information on the demographic processes as well as the economic, social and cultural development of the Republic of Bulgaria for the 2016 - 2019 period.
The publication presents data on main macroeconomic indicators of the national economy - gross domestic product, investments and finance; and economic activity groupings - industry, agriculture,...
Statistical Yearbook 2019
The National Statistical Institute (NSI) has the pleasure to present to the attention of national and foreign users of statistical information the 87th edition of the ‘Statistical Yearbook of the Republic of Bulgaria’ in printed and electronic format.
It provides current statistical information about the demographic, economic and social development of the country for 2013 - 2018 in different territorial and classification aggregations and breakdowns.
According to the Law on Statistics, official source of information in the Republic of Bulgaria is the ...
Statistical Yearbook 2018 in infographics
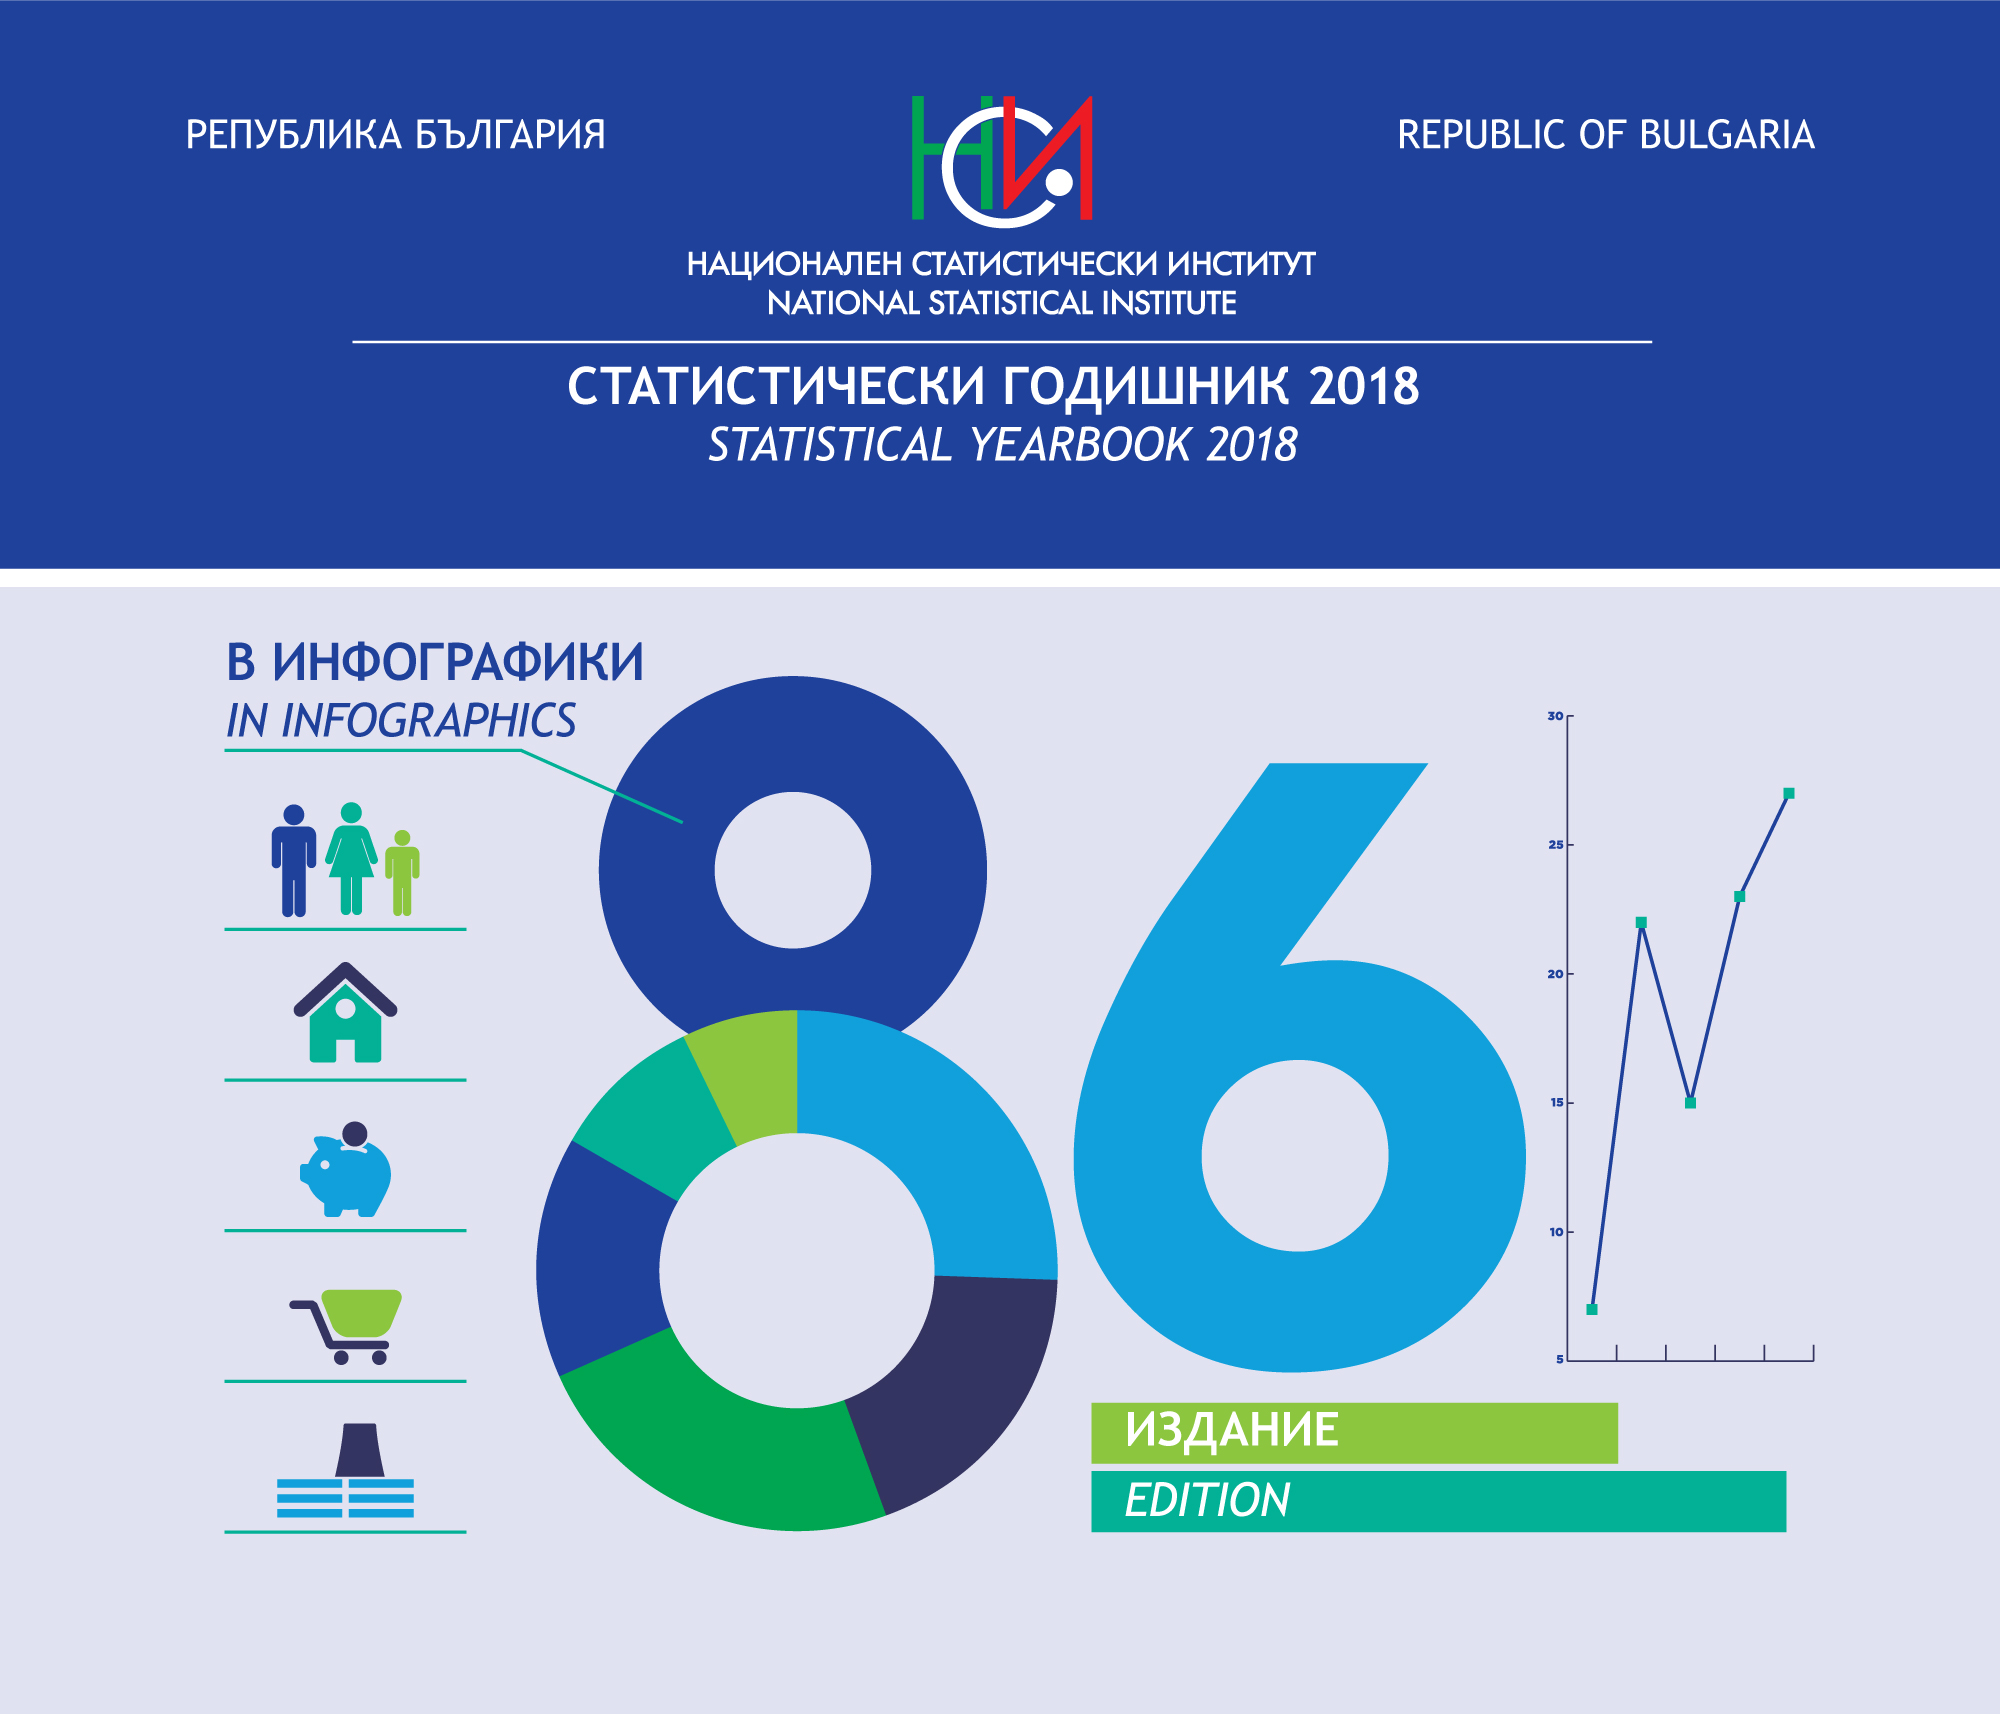
The National Statistical Institute presents to your attention the 86th edition of the Statistical Yearbook of the Republic of Bulgaria in infographics.
In 2018, for the first time, we presented the results of the statistical surveys through graphics, images and other visualization tools, which resulted in a positive response among a wide range of users. We believe that this modern way of presenting statistical information will trigger the interest in those who for the first time encounter the meaning of numbers revealing important aspects of socio-economic life.
...Statistical Reference Book 2019

The National Statistical Institute presents to users of statistical information the annual publication - Statistical Reference Book 2019 in English.
The Statistical Reference Book presents topical information on the demographic processes as well as the economic, social and cultural development of the Republic of Bulgaria for the 2015 - 2018 period.
The publication presents data on main macroeconomic indicators of the national economy - gross domestic product, investments and finance; and economic activity groupings - industry, agriculture, f...
Statistical Reference Book 2019 (Bulgarian version)

The National Statistical Institute presents to users of statistical information the annual publication - Statistical Reference Book 2019 in Bulgarian.
The Statistical Reference Book presents topical information on the demographic processes as well as the economic, social and cultural development of the Republic of Bulgaria for the 2015 - 2018 period.
The publication presents data on main macroeconomic indicators of the national economy - gross domestic product, investments and finance; and economic activity groupings - industry, agriculture, forestry, transp...
Statistical Yearbook 2018

The National Statistical Institute (NSI) has the pleasure to present to the attention of national and foreign users of statistical information the 86th edition of the ‘Statistical Yearbook of the Republic of Bulgaria’ in printed and electronic format.
It provides current statistical information about the demographic, economic and social development of the country for 2012 - 2017 in different territorial and classification aggregations and breakdowns.
According to the Law on Statistics, official source of information in the Republic of Bulgaria is the ...
Statistical Reference Book 2018
The National Statistical Institute presents to users of statistical information the annual publication - Statistical Reference Book 2018 in English.
The Statistical Reference Book presents topical information on the demographic processes as well as the economic, social and cultural development of the Republic of Bulgaria for the 2014 - 2017 period.
The publication presents data on main macroeconomic indicators of the national economy - gross domestic product, investments and finance; and economic activity groupings - industry, agriculture, f...
Statistical Yearbook 2017 in infographics

The National Statistical Institute of Bulgaria offers a different view of the statistical information included in the 85th edition of the Statistical Yearbook of the Republic of Bulgaria.
The publication is intended for a wider audience as statistical data are presented in a plain and easy understandable way.
The current state and changes in the socio-economic and cultural life in the country are presented not in the traditional way in tables and text, but through infographics - images, graphics and other visualization tools.
We belie...
Statistical Reference Book 2018 (Bulgarian version)

The National Statistical Institute presents to users of statistical information the annual publication - Statistical Reference Book 2018 in Bulgarian.
The Statistical Reference Book presents topical information on the demographic processes as well as the economic, social and cultural development of the Republic of Bulgaria for the 2014 - 2017 period.
The publication presents data on main macroeconomic indicators of the national economy - gross domestic product, investments and finance; and economic activity groupings - industry, agriculture, forestry, transp...
Statistical Yearbook 2017
The National Statistical Institute (NSI) has the pleasure to present to the attention of national and foreign users of statistical information the 84th edition of the ‘Statistical Yearbook of the Republic of Bulgaria’ in printed and electronic format.
It provides current statistical information about the demographic, economic and social development of the country for 2012 - 2016 in different territorial and classification aggregations and breakdowns.
According to the Law on Statistics, official source of information in the Republic of Bulgaria is the ...
Statistical Reference Book 2017
The National Statistical Institute presents to users of statistical information the annual publication - Statistical Reference Book 2017 in English.
The Statistical Reference Book presents topical information on the demographic processes as well as the economic, social and cultural development of the Republic of Bulgaria for the 2013 - 2016 period.
The publication presents data on main macroeconomic indicators of the national economy - gross domestic product, investments and finance; and economic activity groupings - industry, agriculture, f...
Statistical Reference Book 2017 (Bulgarian version)

The National Statistical Institute presents to users of statistical information the annual publication - Statistical Reference Book 2017 in Bulgarian.
The Statistical Reference Book presents topical information on the demographic processes as well as the economic, social and cultural development of the Republic of Bulgaria for the 2013 - 2016 period.
The publication presents data on main macroeconomic indicators of the national economy - gross domestic product, investments and finance; and economic activity groupings - industry, agriculture, forestry, transp...
Statistical Yearbook 2016
The National Statistical Institute (NSI) has the pleasure to present to the attention of national and foreign users of statistical information the 84th edition of the ‘Statistical Yearbook of the Republic of Bulgaria’ in printed and electronic format.
It provides current statistical information about the demographic, economic and social development of the country for 2011 - 2015 in different territorial and classification aggregations and breakdowns.
According to the Law on Statistics, official source of information in the Republic of Bulgaria is the ...
Statistical Reference Book 2016

The National Statistical Institute presents to users of statistical information the annual publication - Statistical Reference Book 2016 in English.
The Statistical Reference Book presents topical information on the demographic processes as well as the economic, social and cultural development of the Republic of Bulgaria for the 2012 - 2015 period.
The publication presents data on main macroeconomic indicators of the national economy - gross domestic product, investments and finance; and economic activity groupings - industry, agriculture, forestry, transpor...
Statistical Reference Book 2016 (Bulgarian version)
The National Statistical Institute presents to users of statistical information the annual publication - Statistical Reference Book 2016 in Bulgarian.
The Statistical Reference Book presents topical information on the demographic processes as well as the economic, social and cultural development of the Republic of Bulgaria for the 2012 - 2015 period.
The publication presents data on main macroeconomic indicators of the national economy - gross domestic product, investments and finance; and economic activity groupings - industry, agriculture, forestry, transp...
Statistical Yearbook 2015
The National Statistical Institute (NSI) has the pleasure to present to the attention of national and foreign users of statistical information the 83rd edition of the ‘Statistical Yearbook of the Republic of Bulgaria’ in printed and electronic format.
It provides current statistical information about the demographic, economic and social development of the country for 2010 - 2014 in different territorial and classification aggregations and breakdowns.
According to the Law on Statistics, official source of information in the Republic of Bulgaria is the ...
Statistical Reference Book 2015

The National Statistical Institute presents to users of statistical information the annual publication - Statistical Reference Book 2015 in English.
The Statistical Reference Book presents topical information on the demographic processes as well as the economic, social and cultural development of the Republic of Bulgaria for the 2010 - 2014 period.
The publication presents data on main macroeconomic indicators of the national economy - gross domestic product, investments and finance; and economic activity groupings - industry, agriculture, forestry, transport, c...
Statistical Reference Book 2015 (Bulgarian version)

The National Statistical Institute presents to users of statistical information the annual publication - Statistical Reference Book 2015 in Bulgarian.
The Statistical Reference Book presents topical information on the demographic processes as well as the economic, social and cultural development of the Republic of Bulgaria for the 2010 - 2014 period.
The publication presents data on main macroeconomic indicators of the national economy - gross domestic product, investments and finance; and economic activity groupings - industry, agriculture, forestry, transport,...
Statistical Yearbook 2014
The National Statistical Institute (NSI) has the pleasure to present to the attention of national and foreign users of statistical information the 82nd edition of the ‘Statistical Yearbook of the Republic of Bulgaria’ in printed and electronic format.
It provides current statistical information about the demographic, economic and social development of the country for 2009 - 2013 in different territorial and classification aggregations and breakdowns.
According to the Law on Statistics, official source of information in the Republic of Bulgaria is the Nati...
Statistical Reference Book 2014
The National Statistical Institute presents to users of statistical information the annual publication - Statistical Reference Book 2014 in English.
The Statistical Reference Book presents topical information on the demographic processes as well as the economic, social and cultural development of the Republic of Bulgaria for the 2009 - 2013 period.
The publication presents data on main macroeconomic indicators of the national economy - gross domestic product, investments and finance; and economic activity groupings - industry, agriculture, forestry, tran...
Statistical Reference Book 2014 (Bulgarian version)
The National Statistical Institute presents to users of statistical information the annual publication - Statistical Reference Book 2014 in Bulgarian.
The Statistical Reference Book presents topical information on the demographic processes as well as the economic, social and cultural development of the Republic of Bulgaria for the 2009 - 2013 period.
The publication presents data on main macroeconomic indicators of the national economy - gross domestic product, investments and finance; and economic activity groupings - industry, agriculture, forestry, tr...
Statistical Yearbook 2013
The National Statistical Institute (NSI) has the pleasure to present to the attention of national and foreign users of statistical information the 81st edition of the ‘Statistical Yearbook of the Republic of Bulgaria’ in printed and electronic format.
It provides current statistical information about the demographic, economic and social development of the country for 2008 - 2012 in different territorial and classification aggregations and breakdowns.
According to the Law on Statistics, official source of information in the Republic of Bulgaria is the Nati...
Statistical Reference Book 2013
The National Statistical Institute presents to users of statistical information the annual publication - Statistical Reference Book 2013 in English.
The Statistical Reference Book presents topical information on the demographic processes as well as the economic, social and cultural development of the Republic of Bulgaria for the 2008 - 2012 period.
The publication presents data on main macroeconomic indicators of the national economy - gross domestic product, investments and finance; and economic activity groupings - industry, agric...
Statistical Reference Book 2013 (Bulgarian version)

The National Statistical Institute presents to users of statistical information the annual publication - Statistical Reference Book 2013 in Bulgarian.
The Statistical Reference Book presents topical information on the demographic processes as well as the economic, social and cultural development of the Republic of Bulgaria for the 2008 - 2012 period.
The publication presents data on main macroeconomic indicators of the national economy - gross domestic product, investments and finance; and economic activity groupings - industry, agr...
Statistical Reference Book 2012

The National Statistical Institute presents to users of statistical information the annual publication - Statistical Reference Book 2012 in English.
The Statistical Reference Book represents topical information on the demographic processes as well as the economic, social and cultural development of the Republic of Bulgaria for the 2007 - 2011 period.
The publication presents data on main macroeconomic indicators of the national economy - gross domestic product, investments and finance; and economic activity groupings - industry, agr...
Statistical Reference Book 2012 (Bulgarian version)

The National Statistical Institute presents to users of statistical information the annual publication - Statistical Reference Book 2012 in Bulgarian.
The Statistical Reference Book presents topical information on the demographic processes as well as the economic, social and cultural development of the Republic of Bulgaria for the 2007 - 2011 period.
The publication presents data on main macroeconomic indicators of the national economy - gross domestic product, investments and finance; and economic activity groupings&...
Statistical Yearbook 2011
The National Statistical Institute (NSI) has the pleasure to submit to the attention of national and foreign users of statistical information the 79th edition of the ‘Statistical Yearbook of the Republic of Bulgaria’ in printed and electronic format.
It provides current statistical information about the demographic, economic and social development of the country for the 2005 - 2010 period in different territorial and classification aggregations and breakdowns.
According ...
Statistical Reference Book 2011
The National Statistical Institute presents to users of statistical information the annual publication - Statistical Reference Book 2011 in English. It is a concise form of the same issue in Bulgarian.
The Statistical Reference Book presents topical information on the demographic processes as well as the economic, social and cultural development of the Republic of Bulgaria for the 2006 - 2010 period.
The publication presents data on main macroeconomic indicators of the national economy - gross domestic product, investments...
Statistical Yearbook 2010
The National Statistical Institute (NSI) has the pleasure to submit to the attention of national and foreign users of statistical information the 78th edition of the ‘Statistical Yearbook of the Republic of Bulgaria’ in printed and electronic format.
It provides current statistical information about the demographic, economic and social development of the country for the 2004 - 2009 period in different territorial and classification aggregations and breakdowns.
Accor...
Statistical Yearbook 2009
The National Statistical Institute (NSI) has the pleasure to submit to the attention of national and foreign users of statistical information the 77th edition of the ‘Statistical Yearbook of the Republic of Bulgaria’ in printed and electronic format. The issue is published in 2010, which marks 130 years since the establishment of a statistical institution in Bulgaria and 100 years since publishing of the first ‘Statistical Yearbook of the Bulgarian Kingdom’ in 1910.
This issue has new design and layout. It provides current statistical information about ...
Statistical Reference Book 2010
The National Statistical Institute presents to users of statistical information the annual publication - Statistical Reference Book 2010 in English. It is a concise form of the same issue in Bulgarian.
The Statistical Reference Book presents topical information on the demographic processes as well as the economic, social and cultural development of the Republic of Bulgaria for the 2005 - 2009 period.
The publication presents data on main macroeconomic indicators of the national economy - gross domestic product, investments...
Housing fund 2009
The National Statistical Institute presents to the attention of users having interest in statistical information in the field of social statistics its new electronic publication Housing fund 2009.
The publication Housing fund 2009 contains annual information about residential buildings and dwellings in the Bulgaria. The data are obtained on the basis of results from the Census of dwelling stock as of 1st March, 2001 by accumulation of the number of new constructed dwellings and deduction of the number of destroyed dwellings during...
Statistical Reference Book 2009
The National Statistical Institute presents to users of statistical information the annual publication - Statistical Reference Book 2009 in English. It is a concise form of the same issue in Bulgarian.
The issue is with a new design and enrich contents. For the first time are included methodological and analytic notes towards all chapters. The information is illustrated with a rich graphic materials.
The Statistical Reference Book presents topical information on the demographic processes as well as the economic, social and cultural ...
Main Short-Term Indicators, vol. 2/2009

The National Statistical Institute presents to the users of statistical information the second recently published issue of a quarterly bilingual (Bulgarian/English) publication Main Short-Term Indicators. The publication is available as a printed edition and electronic version on CD-ROM.
The publication contains up-to-date information concerning the situation and the development of the material sphere in short-term aspect by branches: industry, construction, trade, transport and other services as well as tourism, labour market and investment....
Main Short-Term Indicators, vol. 1/2009
The National Statistical Institute has the pleasure to submit to the attention of users of statistical information the first recently published issue of a new quarterly bilingual (Bulgarian/English) publication ‘Main Short-Term Indicators’. The publication is available as a printed edition and on CD-ROM.
The publication contains up-to-date information concerning the situation and the development of the material sphere in short-term aspect by branches: industry, construction, trade, transport and other services as well as tourism, labour market and inves...
Housing Fund 2008
The National Statistical Institute presents to the attention of users having interest in statistical information in the field of social statistics its new electronic publication Housing fund 2008.
The publication Housing fund 2008 contains annual information about residential buildings and dwellings in the Bulgaria. The data are obtained on the basis of results from the Census of dwelling stock as of 1st March, 2001 by accumulation of the number of new constructed dwellings and deduction of the number of destroyed dwellings during...
Statistical Yearbook 2008
The National Statistical Institute has the pleasure to submit to the attention of national and foreign users of statistical information the 76th edition of the Statistical Yearbook of the Republic of Bulgaria 2008. It provides topical statistical information on the demographic, economic and social development of the country for the 2002 - 2007 period in different territorial and classification aggregations and breakdowns.
According to the Law on Statistics, official source of information in the Republic of Bulgaria is the National Statistical System, wh...
Housing Fund 2007
The National Statistical Institute presents to the attention of users having interest in statistical information in the field of social statistics the annual electronic publication 'Housing fund 2007'.
The publication 'Housing fund 2007' contains annual information about residential buildings and dwellings in Bulgaria. The data are obtained on the basis of results from the Census of housing fund as of 1st March, 2001 by accumulation of the number of new constructed housing fund and deduction of the number of destroyed housing fund during the period...
Statistical Reference Book of the Republic of Bulgaria 2008
The National Statistical Institute presents to users of statistical information one of its main publications - Statistical Reference Book of the Republic of Bulgaria 2008 in English. It is a concise form of the same issue in Bulgarian.
The Statistical Reference Book presents topical information on the demographic processes as well as the economic, social and cultural development of the Republic of Bulgaria for the 2004 - 2007 period.
The publication presents data on main macroeconomic indicators of the national economy - gross dom...


