Gender pay gap
| Economic activity | 2019 | 2020 | 2021 | 2022 | 2023 |
|---|---|---|---|---|---|
| Total | 13.6 | 12.0 | 11.4 | 12.1 | 13.1 |
| Mining and quarrying | 14.1 | 13.4 | 14.3 | 14.7 | 18.2 |
| Manufacturing | 23.1 | 23.3 | 23.3 | 24.3 | 22.7 |
| Electricity, gas, steam and air conditioning supply | 6.2 | 2.2 | 1.8 | -2.0 | 0.3 |
| Water supply, sewerage, waste management and remediation activities | 6.4 | 10.0 | 10.3 | 8.4 | 13.1 |
| Construction | -12.4 | -17.3 | -16.9 | -19.7 | -25.0 |
| Wholesale and retail trade;repair of motor vehicles and motorcycles | 11.8 | 9.8 | 11.1 | 9.4 | 9.3 |
| Transportation and storage | 10.5 | 9.1 | 7.2 | 8.1 | 5.5 |
| Accommodation and food service activities | 6.8 | 2.9 | 4.9 | 5.8 | 7.3 |
| Information and communication | 24.3 | 26.2 | 27.7 | 27.3 | 29.3 |
| Financial and insurance activities | 27.6 | 28.7 | 27.8 | 22.6 | 27.6 |
| Real estate activities | -2.5 | -0.1 | 7.9 | 10.1 | 9.5 |
| Professional, scientific and technical activities | 16.1 | 8.2 | 14.2 | 12.0 | 12.8 |
| Administrative and support service activities | -30.3 | -27.3 | -23.5 | -21.9 | -17.1 |
| Public administration and defence; compulsory social security | 8.6 | 10.7 | 12.0 | 9.7 | 12.7 |
| Education | 8.1 | 6.8 | 5.6 | 2.2 | 3.6 |
| Human health and social work activities | 28.6 | 25.4 | 23.8 | 20.5 | 21.5 |
| Arts, entertainment and recreation | 23.7 | 21.0 | 19.1 | 16.6 | 14.9 |
| Other service activities | -2.7 | -0.7 | -3.0 | -10.1 | -10.1 |
2023 - Preliminary data |
|||||
| The gender pay gap is given as the difference between average gross hourly earnings of male paid employees and of female paid employees as a percentage of average gross hourly earnings of male paid employees. The Gender Pay Gap (GPG) is provided for employees working in enterprises with 10+ employees and belonging to all economic activities except "Agriculture, hunting, forestry and fishing" according to NACE.BG 2008. When the value of Gender Pay Gap is positive then the gross hourly earnings of male employees are higher than those of female employees. | |||||
| Contact | |
|---|---|
| Contact organisation | National Statistical Institute |
| Contact organisation unit | "Statistics on Labour costs, Research and Development, Innovation and Information Society Department" |
| Contact name | Todor Davidkov |
| Contact person function | Head of department |
| Contact mail address | 2, P. Volov Str.; 1038 Sofia, Bulgaria |
| Contact email address | |
| Contact phone number | +359 2 9857 568 |
| Contact fax number | |
| Metadata update | |
| Metadata last certified | 31 January 2025 |
| Metadata last posted | 31 January 2025 |
| Metadata last update | 31 January 2025 |
| Statistical presentation | |
| Data description | The gender pay gap in unadjusted form is given as the difference between average gross hourly earnings of male paid employees and of female paid employees as a percentage of average gross hourly earnings of male paid employees. For the years 2006, 2010, 2014 and 2018 the GPG is calculated on base of the results from the four-yearly Structure of Earnings Survey (SES). For the years in which Structure of Earnings Survey is not conducted the GPG is calculated using SES data as benchmark and the variation rate of the average annual gross earnings by gender from the annual survey on Number of employees, wages and salaries and other labour costs. The data are available broken down by economic activities. |
| Classification system | Classification of Economic Activities (CEA-2008, for international use NACE.BG 2008) |
| Sector coverage | The (unadjusted) Gender Pay Gap (GPG) is provided for employees working in enterprises with 10+ employees and belonging to all economic activities except "Agriculture, hunting, forestry and fishing" according to NACE.BG 2008. |
| Statistical concepts and definitions | The indicator has been defined as unadjusted (i.e. not adjusted according to individual characteristics of employees that may explain part of the earnings difference - age, length of service, full-time/part-time employment, education, occupation etc.) because it should give an overall picture of gender inequalities in terms of pay. The GPG figures for 2006, 2010, 2014, 2018 and 2022 are directly computed from the 4-yearly Structure of Earnings Survey, for the intermediate years the indicator is estimated using the variation rate of the average annual gross earnings by gender. |
| Statistical unit | · Employees; · Local units, belonging to enterprises with 10 or more employees. |
| Statistical population | · Employees - all employees, there are no restrictions for age and hours worked; · Size of enterprises: 10 employees or more; · Economic activity - all economic activities except "Agriculture, hunting, forestry and fishing" according to NACE.BG 2008. |
| Reference area | The whole country is covered |
| Time coverage | 2007- 2023 |
| Base period | Not applicable. |
| Unit of measure | |
Per cent (%) | |
| Reference period | |
Calendar year | |
| Institutional mandate | |
| Legal acts and other agreements | The data are based on gentlemen's agreement. |
| Data sharing | Not applicable. |
| Confidentiality | |
| Confidentiality - policy | · Law on Statistics; · Regulation (EC) N0 223/2009 of the European Parliament and of the Council of 11 March 2009 on European statistics (provision 24 and Article 20 (4)) (OJ L 87, p. 164), stipulates the necessity to establish common principles and guidelines ensuring the confidentiality of data used for the production of European statistics and the access to those confidential data with due account for technical developments and the requirements of users in a democratic society. |
| Confidentiality - data treatment | Individual data are not disseminated following the rules set in Article 25 from the Law on Statistics. The dissemination of individual data is done only under Article 26 from the same law. |
| Release policy | |
| Release calendar | Not part from the National Release Calendar. |
| Release calendar access | Not applicable. |
| User access | The data are published on the NSI website, section Labour Market in accordance with the Law on Statistics and the European Statistics Code of Practice respecting the professional independence and aimed at objectivity, transparency and equal treatment of all consumers. |
| Frequency of dissemination | |
Annual | |
| Accessibility and clarity | |
| News release | Not applicable. |
| Publications | Not applicable. |
| On-line database | The indicators are available to all users of the NSI website under the heading Labour Market -Annual statistics on employment and labour cost - Structural indicators - Gender pay gap: https://www.nsi.bg/en/node/6457 |
| Micro-data access | Not applicable. |
| Other | Not applicable. |
| Documentation on methodology | Methodological notes are published as well on the Statistical Office of the European Communities (EUROSTAT) web page: http://epp.eurostat.ec.europa.eu/portal/page/portal/labour_market/earnings/database |
| Quality documentation | |
| Quality management | |
| Quality assurance | According to Article 2, point 3 from the Law on Statistics the statistical information shall be produced in compliance with the following criteria for quality: adequacy, accuracy, timeliness, punctuality, accessibility and clarity, comparability and logical consistency. According to Article 10 from Council Regulation (EC) No 530/1999 of 9 March 1999 concerning structural statistics on earnings and on labour costs the national authorities shall ensure that the results reflect the true situation of the total population of units with a sufficient degree of representativity. |
| Quality assessment | |
| Relevance | |
| User needs | The main users are Eurostat, Ministry of Labour and Social Policy, trade unions and other non-government organizations. |
| User satisfaction | No information available |
| Completeness | GPG is calculated for all the requested breakdowns. |
| Accuracy and reliability | |
| Overall accuracy | See the methodological notes for: · Structure of Earnings Survey; · Annual statistics on Employment and Labour Costs. |
| Sampling error | See the methodological notes for Structure of Earnings Survey. |
| Non-sampling error | See the methodological notes for: · Structure of Earnings Survey; · Annual statistics on Employment and Labour Costs. |
| Timeliness and punctuality | |
| Timeliness | 12 months after the reference year. |
| Punctuality | The punctuality of data publication depends from the availability of the final results for the average gross annual wages and salaries by gender. |
| Coherence and comparability | |
| Comparability - geographical | The definitions are following the one from the Structure of Earnings Survey. |
| Comparability - over time | The comparability over time is disturbed by the changes of the Classification of Economic Activities. |
| Coherence - cross domain | All indicators are internal coherent. |
| Coherence - internal | Data on average wages and salaries broken down by gender are published as well. The main difference between GPG and average wages are due to the following reasons: · Average wages and salaries are per employee, while GPG is per hour; · Average wegaes and salaries cover enterprises from all economic activities and size classes, while GPG is restricted to local units belonging to enterprises with 10 or more employees from all economic activities except "Agriculture, hunting, forestry and fishing" according to NACE.BG 2008. |
| Cost and burden | |
No information is available for the respondents' burden. | |
| Data revision | |
| Data revision - policy | Annual estimated data are revised every four years when the data from the Structure of Earnings Survey become available. |
| Data revision - practice | The variation of hourly earnings of male and female employees between consecutive Structure of Earnings Surveys is taken into account. |
| Statistical processing | |
| Source data | · Structure of Earnings Survey (Four-yearly); · Annual survey on Number of employees, wages and salaries and other labour costs. |
| Frequency of data collection | Annual, Four-yearly |
| Data collection | Structure of Earnings Survey is a sample survey. The Annual survey on Number of employees, wages and salaries and other labour costs is census type. |
| Data validation | Logical and arithmetical checks are applied. |
| Data compilation | The GPG data are based on the results from other statistical surveys. |
| Adjustment | Not applicable. |
| Comment | |
Labour Force Survey 2024, Main Results
According to the results of the Labour Force Survey, in 2024:
- The unemployment rate was 4.2%, by 0.1 percentage points lower compared to 2023.
- The employment rate of the population aged 15 - 64 increased by 0.2 percentage points in comparison with 2023 and stood at 70.9%.
- The activity rate of the population aged 15 - 64 was 74.0%, by 0.1 percentage points higher compared to 2023.
The data are from the Labour Force Survey - a sample statistical survey. It is carried out over a sample of non-institutional households. Quarterly, about 19.6 thousand...
Employees under Labour Contract and Gross Average Wages and Salaries, Fourth Quarter of 2024
Number of employees at the end of December 2024 decreased by 0.5%, compared to the end of September, and reached 2.31 million. In the fourth quarter of 2024, the average wages and salaries was 2 413 BGN, increasing by 6.1% compared to the third quarter.
...Main Labour Force Survey Results, Fourth Quarter of 2024
According to the results from the Labour Force Survey, in the fourth quarter of 2024:
- The unemployment rate was 3.8%, by 0.4 percentage points lower compared to the fourth quarter of 2023;
- The employment rate of the population aged 15 - 64 increased by 0.2 percentage points in comparison with the same quarter of 2023 and stood at 70.7%;
- The activity rate of the population aged 15 - 64 was 73.6%, by 0.1 percentage points lower compared to the fourth quarter of 2023.
The data are from the Labour Force Survey - a sample statistical s...
Pension and Labour market participation - Module to the Labour Force Survey in 2023
The National Statistical Institute has published data from the LFS module 2023 “Pension and labour market participation”, covering persons aged 50 to 74 years inclusive. The survey was jointly financed by the NSI and by the European Commission.
According to the module results, 79.1% of people aged 50 - 74 stopped working after retirement, 16.7% continued working and 4.2% were not working at the time of retirement.
Of the persons who continued to work after retirement, 62.8% worked for financial reasons, 31.3% because they enjoyed working, being productive, or being ...
Employees Under Labour Contract and Gross Average Wages and Salaries in 2023
The number of employees under labour contract in 2023 increased by 24.1 thousand, or by 1.1%, as compared to 2022 and reached 2.30 million according to the final data of the National Statistical Institute (NSI).
The average annual gross wages and salaries of the employees under labour contract in 2023 amounted to 24 485 BGN and increased by 15.3% compared to 2022.
...Main Labour Force Survey Results, Third Quarter of 2024
According to the results from the Labour Force Survey, in the third quarter of 2024:
- The unemployment rate was 3.6%, by 0.4 percentage points lower compared to the third quarter of 2023;
- The employment rate of the population aged 15 - 64 increased by 0.2 percentage points in comparison with the same quarter of 2023 and stood at 71.7%;
- The activity rate of the population aged 15 - 64 was 74.4%, by 0.2 percentage points lower compared to the third quarter of 2023.
The data are from the Labour Force Survey - a sample statistical surv...
Employees under Labour Contract and Gross Average Wages and Salaries, Third Quarter of 2024
The number of employees under labour contract at the end of September 2024 decreased by 22.8 thousand, or 1.0%, as compared to the end of June 2024 and reached 2.33 million according to the preliminary data of the National Statistical Institute (NSI). The highest decrease was observed in the economic activities: ‘Accommodation and food service activities’ - by 11.5%, ‘Agriculture, forestry and fishing’ - by 3.2%, and ‘Arts, entertainment and recreation’ - by 2.8%. The highest increase of the number of employees - by 1.2% was recorded in the economic activity ‘Human health and social work ac...
Main Labour Force Survey Results, Second Quarter of 2024
According to the results of the Labour Force Survey, in the second quarter of 2024:
- The unemployment rate was 4.3%, by 0.3 percentage points lower compared to the second quarter of 2023;
- The employment rate of the population aged 15 - 64 increased by 0.7 percentage points in comparison with the same quarter of 2023 and stood at 71.0%;
- The activity rate of the population aged 15 - 64 was 74.1%, by 0.4 percentage points higher compared to the second quarter of 2023.
The data are from the Labour Force Survey - a sample statistical survey. It is car...
Employees under Labour Contract and Gross Average Wages and Salaries, Second Quarter of 2024
The number of employees under labour contract at the end of June 2024 increased by 1.2% as compared to the end of March 2024 and reached 2.35 million according to the preliminary data of the National Statistical Institute (NSI). The highest increase was observed in the economic activities: ‘Accommodation and food service activities’ - by 24.0%, ‘Agriculture, forestry and fishing’ - by 4.5%, and ‘Administrative and support service activities’ - by 1.8%. The highest decrease of the number of employees - by 1.7% was recorded in the economic activity ‘Manufacturing’.
In the second qua...
Structure of Earnings Survey 2022
The survey results relate to a population of 2 317 407 employees under labour contracts. In October 2022 the average gross hourly earnings are 10.14 BGN. The gross hourly earnings of full-time employees are 10.44 BGN and the gross hourly earnings of part-time employees are 27% lower (7.63 BGN). The gross hourly earnings of females are 9.49 BGN and represent 88% of the earnings of males who earn 10.82 BGN per hour.
...Quarterly Labour Cost Index, First Quarter of 2024
In the first quarter of 2024, compared to the first quarter of 2023, the total hourly labour cost rose by 15.8% (preliminary data). The total hourly labour cost increased by 13.9% in industry, by 16.3% in services and by 19.3% in construction.
The highest annual growth in total labour costs was recorded in ‘Other service activities’ - by 20.8%, ‘Accommodation and food service activities’ - by 20.6%, and ‘Construction’ - by 19.3%.
...Main Labour Force Survey Results, First Quarter of 2024
According to the results of the Labour Force Survey, in the first quarter of 2024:
- The unemployment rate was 5.0%, by 0.6 percentage points higher compared to the first quarter of 2023;
- The employment rate of the population aged 15 - 64 decreased by 0.2 percentage points in comparison with the same quarter of 2023 and stood at 70.2%;
- The activity rate of the population aged 15 - 64 was 74.0%, by 0.3 percentage points higher compared to the first quarter of 2023.
The data are from the Labour Force Survey - a sample statistical surv...
Employees under Labour Contract and Gross Average Wages and Salaries, First Quarter of 2024
The number of employees under labour contract at the end of March 2024 increased by 1.4% as compared to the end of December 2023 and reached 2.32 million according to the preliminary data of the National Statistical Institute (NSI). The highest increase was observed in the economic activities: ‘Accommodation and food service activities’ - by 6.1%, ‘Information and communication’ - by 5.3%, and ‘Professional, scientific and technical activities’ - by 3.2%. The highest decrease of the number of employees - by 0.6% was recorded in the economic activities ‘Mining and quarryi...
Quarterly Labour Cost Index, Fourth Quarter of 2023
In the fourth quarter of 2023, compared to the fourth quarter of 2022, the total hourly labour cost rose by 11.7% (preliminary data). The total hourly labour cost increased by 10.6% in industry, by 10.4% in services and by 19.5% in construction.
The highest annual growth in total labour costs was recorded in ‘Public administration and defence; compulsory social security’ - by 19.8%, ‘Construction’ - by 19.5%, and ‘Education’ - by 17.0%.
...Labour Force Survey 2023, Main Results
According to the results of the Labour Force Survey, in 2023:
- The activity rate of the population aged 15 - 64 was 73.9%, increasing by 0.2 percentage points in comparison with 2022.
- The employment rate of the population aged 15 - 64 was 70.7%.
- The unemployment rate was 4.3%, or 0.2 percentage points higher in comparison with 2022.
The Labour Force Survey is a sample statistical survey. It is carried out over a sample of non-institutional households. Quarterly, about 19.6 thousand households, randomly selected, are observed through a f...
Main Labour Force Survey Results, Fourth Quarter of 2023
In the fourth quarter of 2023:
- The unemployment rate was 4.2%, by 0.5 percentage points higher compared to the fourth quarter of 2022;
- The employment rate of the population aged 15 - 64 decreased by 1.2 percentage points in comparison with the same quarter of 2022 and stood at 70.5%;
- The activity rate of the population aged 15 - 64 was 73.7%, by 0.8 percentage points lower compared to the fourth quarter of 2022.
The data was from the Labour Force Survey - a sample statistical survey. It is carried out over a sample of non-institut...
Employees under Labour Contract and Gross Average Wages and Salaries, Fourth Quarter of 2023
The number of employees under labour contract at the end of December 2023 decreased by 0.5% as compared to the end of September 2023 and reached 2.29 million according to the preliminary data of the National Statistical Institute (NSI). The highest decrease was observed in economic activities: ‘Accommodation and food service activities’ - by 6.6%, ‘Agriculture, forestry and fishing’- by 5.9%, and ‘Transportation and storage’ - by 1.3%. The highest increase of the number of employees was recorded in economic activities ‘Arts, entertainment and recreation’ - by 1.6%, and ‘Human...
Quarterly Labour Cost Index, Third Quarter of 2023
In the third quarter of 2023, compared to the third quarter of 2022, the total hourly labour cost rose by 15.1% (preliminary data). The total hourly labour cost increased by 16.6% in industry, 13.9% in services and 17.0% in construction.
The highest annual growth in total labour costs was recorded in ‘Education’ - by 21.9%, ‘Accommodation and food service activities’ - by 18.8%, and ‘Transportation and storage’ - by 17.4%.
...Main Labour Force Survey Results, Third Quarter of 2023
In the third quarter of 2023:
- The unemployment rate was 4.0%, by 0.4 percentage points higher in comparison with the third quarter of 2022;
- The employment rate of the population aged 15 - 64 decreased by 0.6 percentage points in comparison with the same quarter of 2022 and stood at 71.5%;
- The activity rate of the population aged 15 - 64 was 74.6%, by 0.2 percentage points lower compared to the third quarter of 2022.
The data was from the Labour Force Survey - a sample statistical survey. It is carried out over a sample of non-institutional house...
Employees under Labour Contract and Gross Average Wages and Salaries, Third Quarter of 2023
The number of employees under labour contract at the end of September 2023 decreased by 1.5% compared to the end of June 2023 and reached 2.30 million according to the preliminary data of the National Statistical Institute (NSI). The highest decrease was observed in economic activities: ‘Accommodation and food service activities’ - by 15.8%, ‘Administrative and support service activities’ - by 2.7%, and ‘Manufacturing’ - by 1.4%. The highest increase of the number of employees by 1.1% was recorded in economic activity ‘Human health and social work activities’.
In the third quarter...
Quarterly Labour Cost Index, Second Quarter of 2023
In the second quarter of 2023, compared to the second quarter of 2022, the total hourly labour cost rose by 13.8% (preliminary data). The total hourly labour cost increased by 19.3% in industry, 13.7% in services and 16.1% in construction.
The highest annual growth in total labour costs was recorded in ‘Accommodation and food service activities’ - by 24.0%, ‘Manufacturing’ - by 20.1%, and ‘Electricity, gas, steam and air conditioning supply’ - by 18.3%.
...Main Labour Force Survey Results, Second Quarter of 2023
In the second quarter of 2023:
- The unemployment rate was 4.6%, or 0.1 percentage point higher in comparison with the second quarter of 2022;
- The employment rate of the population aged 15 - 64 increased by 0.3 percentage points in comparison with the same quarter of 2022 and reached 70.3%;
- The activity rate of the population aged 15 - 64 was 73.7%, increasing by 0.3 percentage points in comparison with the second quarter of 2022.
The data was from the Labour Force Survey - a sample statistical survey. It is carried out over a sampl...
Employees under Labour Contract and Gross Average Wages and Salaries, Second Quarter of 2023
The number of employees under labour contract at the end of June 2023 increased by 25.2 thousand, or 1.1%, as compared to the end of March 2023 and reached 2.33 million according to the preliminary data of the National Statistical Institute (NSI). The highest increase was observed in economic activities: ‘Accommodation and food service activities’ - by 29.1%, ‘Agriculture, forestry and fishing’- by 3.8% and ‘Real estate activities’ - by 1.8%. The highest decrease of the number of employees by 1.6% was recorded in economic activity ‘Education’.
In the second quarter of 2023, ...
Quarterly Labour Cost Index, First Quarter of 2023
In the first quarter of 2023 compared to the first quarter of 2022 the total hourly labour cost rose by 15.1% (preliminary data). The total hourly labour cost increased by 18.2% in industry, 15.7% in services and 14.1% in construction.
The highest annual growth in total labour costs was recorded in ‘Transportation and storage’ - by 23.6%, ‘Accommodation and food service activities’ - by 23.5%, and ‘Water supply, sewerage, waste management and remediation activities’ - by 19.6%.
...Main Labour Force Survey Results, First Quarter of 2023
In the first quarter of 2023:
- The unemployment rate was 4.4%, or 0.4 percentage points lower in comparison with the first quarter of 2022;
- The employment rate of the population aged 15 - 64 increased by 1.6 percentage points in comparison with the same quarter of 2022 and reached 70.4%;
- The activity rate of the population aged 15 - 64 was 73.7%, increasing by 1.4 percentage points in comparison with the first quarter of 2022.
The data was from the Labour Force Survey - a sample statistical survey. It is carried out over a sample o...
Employees under Labour Contract and Gross Average Wages and Salaries, First Quarter of 2023
The number of employees under labour contract at the end of March 2023 increased by 47.5 thousand, or 2.1%, as compared to the end of December 2022 and reached 2.31 million according to the preliminary data of the National Statistical Institute (NSI). The highest increase was observed in economic activities: ‘Human health and social work activities’ - by 7.1%, ‘Accommodation and food service activities’ - by 4.7%, and ‘Construction’ - by 4.3%. Decrease of the number of employees by 0.2% was recorded in economic activity ‘Public administration and defence; compulsory social se...
Quarterly Labour Cost Index, Fourth Quarter of 2022
By 16.1% rose the total hourly labour cost for the fourth quarter of 2022 compared to the fourth quarter of 2021 (preliminary data). The total hourly labour cost increased by 21.3% in industry, 17.8% in services and 11.0% in construction.
The breakdown by economic activities showed that the highest annual growth in total labour costs was recorded in ‘Electricity, gas, steam and air conditioning supply’ - by 33.3%, ‘Accommodation and food service activities’ - by 32.9%, and ‘Arts, entertainment and recreation’ - by 25.2%.
...Labour Force Survey 2022, Main Results
According to the results of the survey, in 2022:
- The activity rate of the population aged 15 - 64 was 73.6%, increasing by 1.6 percentage points in comparison with 2021.
- The employment rate of the population aged 15 - 64 increased by 2.3 percentage points in comparison with 2021 and reached 70.4%.
- The unemployment rate was 4.3%, or 1.0 percentage point lower in comparison with 2021.
The Labour Force Survey is a sample statistical survey. It is carried out over a sample of non-institutional households...
Main Labour Force Survey Results, Fourth Quarter of 2022
According to the results of the survey, in the fourth quarter of 2022:
- The activity rate of the population aged 15 - 64 was 74.4%, increasing by 2.6 percentage points in comparison with the fourth quarter of 2021.
- The employment rate of the population aged 15 - 64 increased by 3.0 percentage points in comparison with the same quarter of 2021 and reached 71.5%.
- The unemployment rate was 3.9%, or 0.6 percentage points lower in comparison with the fourth quarter of 2021.
The Labour Force Survey is a sample statistical survey. It is carried out over...
Employees under Labour Contract and Gross Average Wages and Salaries, Fourth Quarter of 2022
The number of employees under labour contract at the end of December 2022 decreased by 0.7%, as compared to the end of September 2022 and reached 2.26 million according to the preliminary data of the National Statistical Institute. The highest decrease was observed in economic activities: ‘Administrative and support service activities’ - by 5.9%, ‘Accommodation and food service activities’- by 5.8% and ‘Agriculture, forestry and fishing’ - by 4.5%. The highest increase in the number of employees was recorded in economic activities: ‘Education’ - by 1.2% and ‘Arts, entertainment and re...
Quarterly Labour Cost Index, Third Quarter of 2022
By 16.2% rose the total hourly labour cost for the third quarter of 2022 compared to the third quarter of 2021 (preliminary data of the NSI). The total hourly labour cost increased by 18.1% in industry, 16.4% in services and 16.0% in construction.
The breakdown by economic activities showed that the highest annual growth in total labour costs was recorded in ‘Accommodation and food service activities’ - by 23.4%, ‘Mining and quarrying’ - by 19.4% and ‘Public administration and defence; compulsory social security’ - by 19.2%.
...Main Labour Force Survey Results, Third Quarter of 2022
According to the results of the survey, in the third quarter of 2022:
- The activity rate of the population aged 15 - 64 was 74.7%, increasing by 1.8 percentage points in comparison with the third quarter of 2021.
- The employment rate of the population aged 15 - 64 increased by 2.4 percentage points in comparison with the same quarter of 2021 and reached 71.9%.
- The unemployment rate was 3.7%, or 0.9 percentage points lower in comparison with the third quarter of 2021.
The Labour Force Survey is a sample statistical survey. It is carried out over a ...
Employees under Labour Contract and Gross Average Wages and Salaries, Third Quarter of 2022
According to the preliminary data of the National Statistical Institute, at the end of September 2022, the number of employees under labour contract decreased by 1.4% as compared to the end of June 2022 and reached 2.28 million.
In the third quarter of 2022, in comparison with the second quarter of 2022, the average monthly wages and salaries increased by 0.8% and reached 1 743 BGN.
...Quarterly Labour Cost Index, Second Quarter of 2022
By 14.4% rose the total hourly labour cost for the second quarter of 2022 compared to the second quarter of 2021 (preliminary data of the NSI). The total hourly labour cost increased by 15.0% in industry, 16.8% in services and 11.5% in construction.
The breakdown by economic activities showed that the highest annual growth in total labour costs was recorded in ‘Administrative and support service activities’ - by 22.5%, ‘Arts, entertainment and recreation’, ‘Other service activities’ - by 19.4% each, and ‘Wholesale and retail trade; repair of motor vehicles and motorcycles’ by 18.2...
Main Labour Force Survey Results, Second Quarter of 2022
In the second quarter of 2022 the unemployment rate was 4.7%, and the employment rate of population aged 20 - 64 was 75.0%.
...Employees under Labour Contract and Gross Average Wages and Salaries, Second Quarter of 2022
According to the preliminary data of the National Statistical Institute at the end of June 2022, the number of employees under labour contract increased by 1.5% as compared to the end of March 2022 and reached 2.31 million.
In the second quarter of 2022, in comparison with the first quarter of 2022, the average monthly wages and salaries increased by 7.8% and reached 1 730 BGN.
...Quarterly Labour Cost Index, First Quarter of 2022
Preliminary data of the NSI for the first quarter of 2022 indicate that the total hourly labour cost rose by 12.7% compared to the first quarter of 2021.
...Main Labour Force Survey Results, First Quarter of 2022
In the first quarter of 2022 the unemployment rate was 4.9%, and the employment rate of population aged 20 - 64 was 73.7%.
...Employees under Labour Contract and Gross Average Wages and Salaries, First Quarter of 2022
According to the preliminary data of the National Statistical Institute at the end of March 2022 the number of employees under labour contract increased by 0.4% as compared to the end of December 2021 and reached 2.27 million.
In the first quarter of 2022 in comparison with the fourth quarter of 2021 the average monthly wages and salaries decreased by 1.2% getting 1 593 BGN.
...Quarterly Labour Cost Index, Fourth Quarter of 2021
Preliminary data of the NSI for the fourth quarter of 2021 indicate that the total hourly labour cost rose by 12.1% compared to the fourth quarter of 2020.
...Labour Force Survey 2021, Main Results
In 2021 the unemployment rate was 5.3%.
The employment rate of population aged 20 - 64 years was 73.2%.
...Main Labour Force Survey Results, Fourth Quarter of 2021
In the fourth quarter of 2021 the unemployment rate was 4.5%, and the employment rate of population aged 20 - 64 was 73.6%.
...Employees under Labour Contract and Gross Average Wages and Salaries, Fourth Quarter of 2021
According to the preliminary data of the National Statistical Institute at the end of December 2021 the number of employees under labour contract decreased by 0.7% as compared to the end of September 2021 and reached 2.27 million.
In the fourth quarter of 2021 in comparison with the third quarter of 2021 the average monthly wages and salaries increased by 6.1% getting 1 612 BGN.
...Quarterly Labour Cost Index, Third Quarter of 2021
Preliminary data of the NSI for the third quarter of 2021 indicate that the total hourly labour cost rose by 13.8% compared to the third quarter of 2020.
...Main Labour Force Survey Results, Third Quarter of 2021
In the third quarter of 2021 the unemployment rate was 4.6%, and the employment rate of population aged 20 - 64 was 74.5%.
...Employees under Labour Contract and Gross Average Wages and Salaries, Third Quarter of 2021
According to the preliminary data of the National Statistical Institute at the end of September 2021 the number of employees under labour contract decreased by 1.0% as compared to the end of June 2021 and reached 2.28 million.
In the third quarter of 2021 in comparison with the second quarter of 2021 the average gross monthly wages and salaries decreased by 0.3% - getting to 1 520 BGN.
...Quarterly Labour Cost Index, Second Quarter of 2021
Preliminary data of the NSI for the second quarter of 2021 indicate that the total hourly labour cost rose by 6.7% compared to the second quarter of 2020.
...Main Labour Force Survey Results, Second Quarter of 2021
In the second quarter of 2021 the unemployment rate was 5.6%, and the employment rate of population aged 20 - 64 was 72.7%.
...Employees under Labour Contract and Gross Average Wages and Salaries, Second Quarter of 2021
According to the preliminary data of the National Statistical Institute at the end of June 2021, the number of employees under labour contract increased by 1.9% as compared to the end of March 2021 and reached 2.31 million.
In the second quarter of 2021, in comparison with the first quarter of 2021 the average monthly wages and salaries increased by 4.3% getting 1 525 BGN.
...Quarterly Labour Cost Index, First Quarter of 2021
Preliminary data of the NSI for the first quarter of 2021 indicate that the total hourly labour cost rose by 4.9% compared to the first quarter of 2020.
...Main Labour Force Survey Results, First Quarter of 2021
In the first quarter of 2021 the unemployment rate was 6.3%, and the employment rate of population aged 20 - 64 was 71.7%.
...Employees under Labour Contract and Gross Average Wages and Salaries, First Quarter of 2021
According to the preliminary data of the National Statistical Institute at the end of March 2021 the number of employees under labour contract increased by 1.5% as compared to the end of December 2020 and reached 2.26 million.
In the first quarter of 2021 in comparison with the fourth quarter of 2020 the average monthly wages and salaries increased by 1.7% getting 1 462 BGN.
...Quarterly Labour Cost Index, Fourth Quarter of 2020
Preliminary data of the NSI for the fourth quarter of 2020 indicate that the total hourly labour cost rose by 10.0% compared to the fourth quarter of 2019.
...Labour Force Survey 2020, Main Results
In 2020 the unemployment rate achieved 5.1%, by 0.9 percentage points higher in comparison with 2019.
The employment rate for the age group 20 - 64 years was 73.4%, by 1.6 percentage points lower compared to 2019.
...Main Labour Force Survey Results, Fourth Quarter of 2020
In the fourth quarter of 2020 the unemployment rate was 5.2%, and the employment rate of population aged 20 - 64 was 73.8%.
...Employees under Labour Contract and Gross Average Wages and Salaries, Forth Quarter of 2020
According to the preliminary data of the National Statistical Institute at the end of December 2020 the number of employees under labour contract decreased by 0.9% as compared to the end of September 2020 and reached 2.23 million.
In the fourth quarter of 2020 in comparison with the third quarter of 2020 the average monthly wages and salaries increased by 4.7% getting 1 437 BGN.
...Quarterly Labour Cost Index, Third Quarter of 2020
Preliminary data of the NSI for the third quarter of 2020 indicate that the total hourly labour cost rose by 3.5% compared to the third quarter of 2019.
...Main Labour Force Survey Results for the Third Quarter of 2020
In the third quarter of 2020 the unemployment rate was 4.8%, and the employment rate of population aged 20 - 64 was 74.6%.
...Employees under Labour Contract and Gross Average Wages and Salaries, Third Quarter of 2020
According to the preliminary data of the National Statistical Institute at the end of September 2020 the number of employees under labour contract increased by 0.4% as compared to the end of June 2020 and reached 2.25 million.
In the third quarter of 2020 in comparison with the second quarter of 2020 the average monthly wages and salaries increased by 2.7% getting 1 373 BGN.
...Quarterly Labour Cost Index, Second Quarter of 2020
Preliminary data of the NSI for the second quarter of 2020 indicate that the total hourly labour cost rose by 9.9% compared to the second quarter of 2019.
...Main Labour Force Survey Results for the Second Quarter of 2020
In the second quarter of 2020 the unemployment rate was 5.9%, and the employment rate of population aged 20 - 64 was 72.2%.
...Employees under Labour Contract and Gross Average Wages and Salaries, Second Quarter of 2020
According to the preliminary data of the National Statistical Institute at the end of June 2020 the number of employees under labour contract decreased by 1.0% as compared to the end of March 2020 and reached 2.24 million.
In the second quarter of 2020 in comparison with the first quarter of 2020 the average monthly wages and salaries increased by 1.5% getting 1 337 BGN.
...Quarterly Labour Cost Index, First Quarter of 2020
Preliminary data of the NSI for the first quarter of 2020 indicate that the total hourly labour cost rose by 10.2% compared to the first quarter of 2019.
...Main Labour Force Survey Results for the First Quarter of 2020
In the first quarter of 2020 the unemployment rate was 4.6%, and the employment rate of population aged 20 - 64 was 73.0%.
...Employees under Labour Contract and Gross Average Wages and Salaries, First Quarter of 2020
According to the preliminary data of the National Statistical Institute at the end of March 2020 the number of employees under labour contract decreased by 1.1% as compared to the end of December 2019 and reached 2.26 million.
In the first quarter of 2020 in comparison with the fourth quarter of 2019 the average monthly wages and salaries increased by 0.3% getting 1 317 BGN.
...Quarterly Labour Cost Index, Fourth Quarter of 2019
Preliminary data of the NSI for the fourth quarter of 2019 indicate that the total hourly labour cost rose by 11.9% compared to the fourth quarter of 2018.
...Labour Force Survey 2019, Main Results
In 2019 the unemployment rate was 4.2% by 1.0 percentage point lower in comparison with 2018.
The employment rate for the age group 20 - 64 years achieved 75.0%, by 2.6 percentage points higher compared to 2018.
...Main Labour Force Survey Results for the Fourth Quarter of 2019
In the fourth quarter of 2019 the unemployment rate was 4.1%, and the employment rate of population aged 20 - 64 was 74.9%.
...Employees under Labour Contract and Gross Average Wages and Salaries, Forth Quarter of 2019
According to the preliminary data of the National Statistical Institute at the end of December 2019 the number of employees under labour contract decreased by 1.0% as compared to the end of September 2019 and reached 2.29 million.
In the fourth quarter of 2019 in comparison with the third quarter of 2019 the average monthly wages and salaries increased by 5.1% getting 1 313 BGN.
...Quarterly Labour Cost Index, Third Quarter of 2019
Preliminary data of the NSI for the third quarter of 2019 indicate that the total hourly labour cost rose by 10.0% compared to the third quarter of 2018.
...Main Labour Force Survey Results for the Third Quarter of 2019
In the third quarter of 2019 the unemployment rate was 3.7%, and the employment rate of population aged 20 - 64 was 76.3%.
...Employees under Labour Contract and Gross Average Wages and Salaries, Third Quarter of 2019
According to the preliminary data of the National Statistical Institute at the end of September 2019 the number of employees under labour contract decreased by 1.7% as compared to the end of June 2019 and reached 2.31 million.
In the third quarter of 2019 in comparison with the second quarter of 2019 the average monthly wages and salaries decreased by 0.9% getting 1 249 BGN.
...Quarterly Labour Cost Index, Second Quarter of 2019
Preliminary data of the NSI for the second quarter of 2019 indicate that the total hourly labour cost rose by 11.0% compared to the second quarter of 2018.
...Main Labour Force Survey Results for the Second Quarter of 2019
In the second quarter of 2019 the unemployment rate was 4.2% and the employment rate of population aged 20 - 64 was 75.7%.
...Employees under Labour Contract and Gross Average Wages and Salaries, Second Quarter of 2019
According to the preliminary data of the National Statistical Institute at the end of June 2019 the number of employees under labour contract increased by 1.5% as compared to the end of March 2019 and reached 2.35 million.
In the second quarter of 2019 in comparison with the first quarter of 2019 the average monthly wages and salaries increased by 4.3% getting 1 260 BGN.
...Quarterly Labour Cost Index, First Quarter of 2019
Preliminary data of the NSI for the first quarter of 2019 indicate that the total hourly labour cost rose by 12.9% compared to the first quarter of 2018.
...Main Labour Force Survey Results for the First Quarter of 2019
In the first quarter of 2019 the unemployment rate was 5.0%, by 0.7 percentage points lower in comparison with the first quarter or 2018.
...Employees under Labour Contract and Gross Average Wages and Salaries, First Quarter of 2019
According to the preliminary data of the National Statistical Institute at the end of March 2019 the number of employees under labour contract increased by 1.1% as compared to the end of December 2018 and reached 2.32 million.
In the first quarter of 2019 in comparison with the fourth quarter of 2018 the average monthly wages and salaries increased by 3.2% getting 1 208 BGN.
...Quarterly Labour Cost Index, Fourth Quarter of 2018
Preliminary data of the NSI for the fourth quarter of 2018 indicate that the total hourly labour cost rose by 5.1% compared to the fourth quarter of 2017.
...Labour Force Survey 2018, Main Results
In 2018 the unemployment rate was 5.2% by 1.0 percentage point lower in comparison with 2017.
The employment rate for the age group 20 - 64 years achieved 72.4%, by 1.1 percentage points higher compared to 2017.
...Main Labour Force Survey Results for the Fourth Quarter of 2018
In the fourth quarter of 2018 the unemployment rate was 4.7% and the employment rate of population aged 20 - 64 was 72.5%.
...Employees under Labour Contract and Gross Average Wages and Salaries, Fourth Quarter of 2018
According to the preliminary data of the National Statistical Institute at the end of December 2018 the number of employees under labour contract decreased by 1.1% as compared to the end of September 2018 and reached 2.29 million.
In the fourth quarter of 2018 in comparison with the third quarter of 2018 the average monthly wages and salaries increased by 4.8% getting 1 171 BGN.
...Quarterly Labour Cost Index, Third Quarter of 2018
Preliminary data of the NSI for the third quarter of 2018 indicate that the total hourly labour cost rose by 8.9% compared to the third quarter of 2017.
...Main Labour Force Survey Results for the Third Quarter of 2018
In the third quarter of 2018 the unemployment rate was 5.0% and the employment rate of population aged 20 - 64 was 73.5%.
...Employees under Labour Contract and Average Wages and Salaries, Third Quarter of 2018
According to the preliminary data of the National Statistical Institute at the end of September 2018 the number of employees under labour contract decreased by 1.6% as compared to the end of June 2018 and reached 2.32 million.
In the third quarter of 2018 in comparison with the second quarter of 2018 the average monthly wages and salaries decreased by 0.7% getting 1 117 BGN.
...Quarterly Labour Cost Index, Second Quarter of 2018
Preliminary data of the NSI for the second quarter of 2018 indicate that the total hourly labour cost rose by 8.5% compared to the second quarter of 2017.
...Main Labour Force Survey Results for the Second Quarter of 2018
In the second quarter of 2018 the unemployment rate was 5.5% and the employment rate of population aged 20 - 64 was 72.6%.
...Employees under Labour Contract and Average Wages and Salaries, Second Quarter of 2018
According to the preliminary data of the National Statistical Institute at the end of June 2018 the number of employees under labour contract increased by 1.8% as compared to the end of March 2018 and reached 2.35 million.
In the second quarter of 2018 in comparison with the first quarter of 2018 the average monthly wages and salaries increased by 4.5% getting 1 125 BGN.
...Quarterly Labour Cost Index, First Quarter of 2018
Preliminary data of the NSI for the first quarter of 2018 indicate that the total hourly labour cost rose by 6.8% compared to the first quarter of 2017.
...Main Labour Force Survey Results for the First Quarter of 2018
In the first quarter of 2018 the unemployment rate was 5.7% and the employment rate of population aged 20 - 64 was 71.1%.
...Employees under Labour Contract and Average Wages and Salaries, First Quarter of 2018
According to the preliminary data of the National Statistical Institute at the end of March 2018 the number of employees under labour contract increased by 1.5% as compared to the end of December 2017 and reached 2.31 million.
In the first quarter of 2018 in comparison with the fourth quarter of 2017 the average monthly wages and salaries decreased by 1.6% getting 1 077 BGN.
...Quarterly Labour Cost Index, Fourth Quarter of 2017
Preliminary data of the NSI for the fourth quarter of 2017 indicate that the total hourly labour cost rose by 12.2% compared to the fourth quarter of 2016.
...Labour Force Survey 2017, Main Results
In 2017 the unemployment rate was 6.2%, 6.4% for men and 5.9% for women.
The employment rate for the age group 20 - 64 years achieved 71.3%, 75.3% for men and 67.3% for women.
...Main Labour Force Survey Results for the Fourth Quarter of 2017
In the fourth quarter of 2017 the unemployment rate was 5.6% and the employment rate of population aged 20 - 64 was 72.1%.
...Employees under Labour Contract and Average Wages and Salaries, Fourth Quarter of 2017
According to the preliminary data of the National Statistical Institute at the end of December 2017 the number of employees under labour contract decreased by 1.5% as compared to the end of September 2017 and reached 2.28 million.
In the fourth quarter of 2017 in comparison with the third quarter of 2017 the average monthly wages and salaries increased by 5.6% getting 1 095BGN.
...Quarterly Labour Cost Index, Third Quarter of 2017
Preliminary data of the NSI for the third quarter of 2017 indicate that the total hourly labour cost rose by 10.7% compared to the third quarter of 2016.
...Main Labour Force Survey Results for the Third Quarter of 2017
In the third quarter of 2017 the unemployment rate was 5.8% and the employment rate of population aged 20 - 64 was 73.0%.
...Employees under Labour Contract and Average Wages and Salaries, Third Quarter of 2017
According to the preliminary data of the National Statistical Institute at the end of September 2017 the number of employees under labour contract decreased by 1.3% as compared to the end of June 2017 and reached 2.31 million.
In the third quarter of 2017 in comparison with the second quarter of 2017 the average monthly wages and salaries decreased by 0.3% getting 1 037 BGN.
...Quarterly Labour Cost Index, Second Quarter of 2017
Preliminary data of the NSI for the second quarter of 2017 indicate that the total hourly labour cost rose by 11.0% compared to the second quarter of 2016.
...Main Labour Force Survey Results for the Second Quarter of 2017
In the second quarter of 2017 the unemployment rate was 6.3% and the employment rate of population aged 20 - 64 was 71.7%.
...Employees under Labour Contract and Average Wages and Salaries, Second Quarter of 2017
According to the preliminary data of the National Statistical Institute at the end of June 2017 the number of employees under labour contract increased by 2.8% as compared to the end of March 2017 and reached 2.34 million.
In the second quarter of 2017 in comparison with the first quarter of 2017 the average monthly wages and salaries increased by 3.4% getting 1 040 BGN.
...Quarterly Labour Cost Index, First Quarter of 2017
Preliminary data of the NSI for the first quarter of 2017 indicate that the total hourly labour cost rose by 10.1% compared to the first quarter of 2016.
...Employees under Labour Contract and Average Wages and Salaries, First Quarter of 2017
According to the preliminary data of the National Statistical Institute at the end of March 2017 the number of employees under labour contract increased by 0.3% as compared to the end of December 2016 and reached 2.28 million.
In the first quarter of 2017 in comparison with the fourth quarter of 2016 the average monthly wages and salaries increased by 1.6% getting 1 006 BGN.
...Main Labour Force Survey Results for the First Quarter of 2017
In the first quarter of 2017 the unemployment rate was 6.9% and the employment rate of population aged 20 - 64 was 68.6%.
...Quarterly Labour Cost Index, Fourth Quarter of 2016
Preliminary data of the NSI for the fourth quarter of 2016 indicate that the total hourly labour cost rose by 8.0% compared to the fourth quarter of 2015.
...Labour Force Survey 2016, Main Results
In 2016 the unemployment rate was 7.6%, and the employment rate of population aged 20 - 64 was 67.7%.
...Employees under Labour Contract and Average Wages and Salaries, Fourth Quarter of 2016
According to the preliminary data of the National Statistical Institute at the end of December 2016 the number of employees under labour contract decreased by 1.7% as compared to the end of September 2016 and reached 2.27 million.
In the fourth quarter of 2016 in comparison with the third quarter of 2016 the average monthly wages and salaries increased by 5.2% getting 990 BGN.
...Main Labour Force Survey Results for the Fourth Quarter of 2016
In the fourth quarter of 2016 the unemployment rate was 6.7% and the employment rate of population aged 20 - 64 was 67.7%.
...Quarterly Labour Cost Index, Third Quarter of 2016
Preliminary data of the NSI for the third quarter of 2016 indicate that the total hourly labour cost rose by 8.4% compared to the third quarter of 2015.
...Main Labour Force Survey Results for the Third Quarter of 2016
In the third quarter of 2016 the unemployment rate was 7.0% and the employment rate of population aged 20 - 64 was 68.5%.
...Employees under Labour Contract and Average Wages and Salaries, Third Quarter of 2016
According to the preliminary data of the National Statistical Institute at the end of September 2016 the number of employees under labour contract decreased by 1.9% as compared to the end of June 2016 and reached 2.31 million.
In the third quarter of 2016 in comparison with the second quarter of 2016 the average monthly wages and salaries decreased by 0.5% getting 941 BGN.
...Quarterly Labour Cost Index, Second Quarter of 2016
Preliminary data of the NSI for the second quarter of 2016 indicate that the total hourly labour cost rose by 7.3% compared to the second quarter of 2015.
...Main Labour Force Survey Results for the Second Quarter of 2016
In the second quarter of 2016 the unemployment rate was 8.0% and the employment rate of population aged 20 - 64 was 68.0%.
...Employees under Labour Contract and Average Wages and Salaries, Second Quarter of 2016
According to the preliminary data of the National Statistical Institute at the end of June 2016 the number of employees under labour contract increased by 3.4% as compared to the end of March 2016 and reached 2.36 million.
In the second quarter of 2016 in comparison with the first quarter of 2016 the average monthly wages and salaries increased by 2.6% getting 946 BGN.
...Quarterly Labour Cost Index, First Quarter of 2016
Preliminary data of the NSI for the first quarter of 2016 indicate that the total hourly labour cost rose by 7.7% compared to the first quarter of 2015.
...Main Labour Force Survey Results for the First Quarter of 2016
In the first quarter of 2016 the employment rate of population aged 20 - 64 was 66.5% and the unemployment rate was 8.6%.
...Employees under Labour Contract and Average Wages and Salaries, First Quarter of 2016
According to the preliminary data of the National Statistical Institute at the end of March 2016 the number of employees under labour contract increased by 2.6% as compared to the end of December 2015 and reached 2.28 million.
In the first quarter of 2016 in comparison with the fourth quarter of 2015 the average monthly wages and salaries increased by 1.7% getting 931 BGN.
...Quarterly Labour Cost Index, Fourth Quarter of 2015
Preliminary data of the NSI for the fourth quarter of 2015 indicate that the total hourly labour cost rose by 5.8% compared to the fourth quarter of 2014.
...Labour Force Survey 2015, Main Results
In 2015 the unemployment rate was 9.1%, and the employment rate of population aged 15 - 64 was 62.9%.
Main Labour Force Survey Results for the Fourth Quarter of 2015
In the fourth quarter of 2015 the unemployment rate was 7.9%, and the employment rate of population aged 20 - 64 was 68.1%.
...Employees under Labour Contract and Average Wages and Salaries, Fourth Quarter of 2015
According to the preliminary data of the National Statistical Institute at the end of December 2015 the number of employees under labour contract decreased by 2.2% as compared to the end of September 2015 and reached 2.22 million.
In the fourth quarter of 2015 in comparison with the third quarter of 2015 the average monthly wages and salaries increased by 4.7% getting 915 BGN.
...Quarterly Labour Cost Index, Third Quarter of 2015
Preliminary data of the NSI for the third quarter of 2015 indicate that the total hourly labour cost rose by 7.4% compared to the third quarter of 2014.
...Main Labour Force Survey Results for the Third Quarter of 2015
In the third quarter of 2015 the unemployment rate was 8.3%, and the employment rate of population aged 20 - 64 was 68.8%.
...Employees under Labour Contract and Average Wages and Salaries, Third Quarter of 2015
According to the preliminary data of the National Statistical Institute at the end of September 2015 the number of employees under labour contract decreased by 1.7% as compared to the end of June 2015 and reached 2.27 million.
In the third quarter of 2015 in comparison with the second quarter of 2015 the average monthly wages and salaries decreased by 0.6% getting 874 BGN.
...Quarterly Labour Cost Index, Second Quarter of 2015
Preliminary data of the NSI for the second quarter of 2015 indicate that the total hourly labour cost rose by 6.8% compared to the second quarter of 2014.
...Main Labour Force Survey Results for the Second Quarter of 2015
In the second quarter of 2015 the unemployment rate was 9.9%, and the employment rate of population aged 20 - 64 was 66.6%.
...Employees under Labour Contract and Gross Average Wages and Salaries, Second Quarter of 2015
According to the preliminary data of the National Statistical Institute at the end of June 2015 the number of employees under labour contract increased by 3.6% as compared to the end of March 2015 and reached 2.31 millions.
In the second quarter of 2015 in comparison with the first quarter of 2015 the average monthly wages and salaries increased by 2.3% getting 879 BGN.
...Quarterly Labour Cost Index, First Quarter of 2015
Preliminary data of the NSI for the first quarter of 2015 indicate that the total hourly labour cost rose by 6.9% compared to the first quarter of 2014.
...Main Labour Force Survey Results for the First Quarter of 2015
In the first quarter of 2015 the unemployment rate was 10.6%, and the employment rate of population aged 20 - 64 was 65.0%.
...Employees under Labour Contract and Gross Average Wages and Salaries, First Quarter of 2015
According to the preliminary data of the National Statistical Institute at the end of March 2015 the number of employees under labour contract increased by 1.2% as compared to the end of December 2014 and reached 2.23 millions.
In the first quarter of 2015 in comparison with the fourth quarter of 2014 the average monthly wages and salaries increased by 1.4% getting 859 BGN.
...Quarterly Labour Cost Index, Fourth Quarter of 2014
Preliminary data of the NSI for the fourth quarter of 2014 indicate that the total hourly labour cost rose by 3.1% compared to the fourth quarter of 2013.
...Labour Force Survey 2014, Main Results
Main Labour Force Survey Results for the Fourth Quarter of 2014
In the fourth quarter of 2014 the unemployment rate was 10.6%, and the employment rate of population aged 15 - 64 was 61.4%.
...Employees under Labour Contract and Gross Average Wages and Salaries, Fourth Quarter of 2014
According to the preliminary data of the National Statistical Institute (NSI) at the end of December 2014 the number of employees under labour contract decreased by 2.1% as compared to the end of September 2014 and reached 2.20 millions.
In the fourth quarter of 2014 in comparison with the third quarter of 2014 the average monthly wages and salaries increased by 4.7% getting 847 BGN.
...Quarterly Labour Cost Index, Third Quarter of 2014
Preliminary data of the NSI for the third quarter of 2014 indicate that the total hourly labour cost rose by 3.2% compared to the third quarter of 2013.
...Key Indicators for Bulgaria (as of 30.12.2024)
Key Indicators for Bulgaria (as of 02.10.2024)
Key Indicators for Bulgaria (as of 03.07.2024)
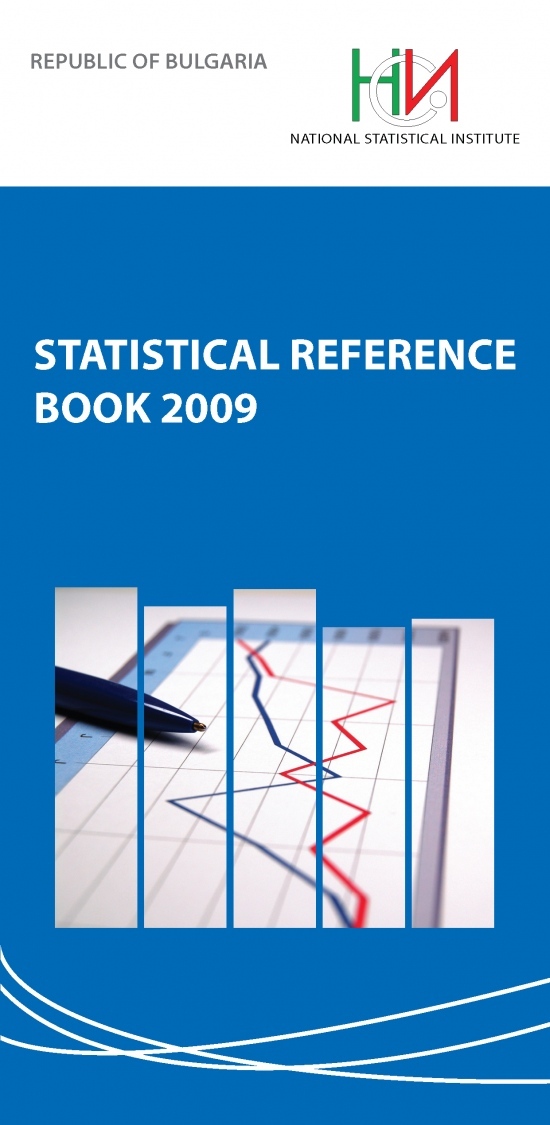
Statistical Reference Book 2024
Тhe National Statistical Institute presents to the users of statistical information the annual publication - Statistical Reference Book 2024 in English.
The Statistical Reference Book presents up-to-date information on the demographic processes as well as the economic, social and cultural development of the Republic of Bulgaria for the 2019 - 2023 period.
The publication presents data on main macroeconomic indicators of the national economy - gross domestic product, investments and finance; and economic acti...
Statistical Reference Book 2024 (Bulgarian version)
The National Statistical Institute presents to users of statistical information the annual publication - Statistical Reference Book 2024 in Bulgarian.
The Statistical Reference Book presents up-to-date information on the demographic processes as well as the economic, social and cultural development of the Republic of Bulgaria for the 2019 - 2023 period.
The publication presents data on main macroeconomic indicators of the national economy - gross domestic product, investments and finance; and economic activity groupings - industry, agriculture, forestry,...
Statistical Yearbook 2023
The National Statistical Institute (NSI) has the pleasure to present to the attention of national and foreign users of statistical information the 91-st edition of the ‘Statistical Yearbook of the Republic of Bulgaria’ in printed format.
It provides current statistical information about the demographic, economic and social development of the country for 2017 - 2022 in different territorial and classification aggregations and breakdowns.
According to the Law on Statistics, official source of information in the Republic of Bulgaria is the National Statistical Sys...
Key Indicators for Bulgaria (as of 03.04.2024)
Key Indicators for Bulgaria (as of 29.12.2023)
Key Indicators for Bulgaria (as of 02.10.2023)
Statistical Reference Book 2023 (Bulgarian version)
The National Statistical Institute presents to users of statistical information the annual publication - Statistical Reference Book 2023 in Bulgarian.
The Statistical Reference Book presents topical information on the demographic processes as well as the economic, social and cultural development of the Republic of Bulgaria for the 2018 - 2022 period.
The publication presents data on main macroeconomic indicators of the national economy - gross domestic product, investments and finance; and economic activity groupings ...
Statistical Reference Book 2023
The National Statistical Institute presents to users of statistical information the annual publication - Statistical Reference Book 2023 in English.
The Statistical Reference Book presents topical information on the demographic processes as well as the economic, social and cultural development of the Republic of Bulgaria for the 2018 - 2022 period.
The publication presents data on main macroeconomic indicators of the national economy - gross domestic product, investments and finance; and economic activity groupings - industry, agriculture, fore...
Key Indicators for Bulgaria (as of 03.07.2023)
Statistical Yearbook 2022
It provides current statistical information about the demographic, economic and social development of the country for 2016 - 2021 in different territorial and classification aggregations and breakdowns.
According to the Law on Statistics, official source of information in the Republic of Bulgaria is the National Statistical ...
Key Indicators for Bulgaria (as of 03.04.2023)
Key Indicators for Bulgaria (as of 30.12.2022)
Key Indicators for Bulgaria (as of 03.10.2022)
Employment and Unemployment - annual data 2021
The bilingual (Bulgarian-English) publication presents annual average data from the Labour force survey. The Labour force survey is a sample statistical survey on households for examination of the economic activity of the population aged 15 years and over.
The methodology of the survey has been developed according to ILO and Eurostat recommendations.
Statistical Reference Book 2022
The Statistical Reference Book presents topical information on the demographic processes as well as the economic, social and cultural development of the Republic of Bulgaria for the 2017 - 2021 period.
The publication presents data on main macroeconomic indicators of the national economy - gross domestic product, investments and finance; and economic activity groupings - industry, agriculture, ...
Statistical Reference Book 2022 (Bulgarian version)
The National Statistical Institute presents to users of statistical information the annual publication - Statistical Reference Book 2022 in Bulgarian.
The Statistical Reference Book presents topical information on the demographic processes as well as the economic, social and cultural development of the Republic of Bulgaria for the 2017 - 2021 period.
The publication presents data on main macroeconomic indicators of the national economy - gross domestic product, investments and finance; and economic activity groupings - industry, agriculture, fo...
Key Indicators for Bulgaria (as of 04.07.2022)
Statistical Yearbook 2021
It provides current statistical information about the demographic, economic and social development of the country for 2015 - 2020 in different territorial and classification aggregations and breakdowns.
According to the Law on Statistics, official source of information in the Republic of Bulgaria is the ...
Key Indicators for Bulgaria (as of 04.04.2022)
Key Indicators for Bulgaria (as of 31.12.2021)
Key Indicators for Bulgaria (as of 04.10.2021)
Employment and Unemployment - annual data 2020
The bilingual (Bulgarian-English) publication presents annual average data from the Labour force survey. The Labour force survey is a sample statistical survey on households for examination of the economic activity of the population aged 15 years and over.
The methodology of the survey has been developed according to ILO and Eurostat recommendations.
Statistical Reference Book 2021
The Statistical Reference Book presents topical information on the demographic processes as well as the economic, social and cultural development of the Republic of Bulgaria for the 2016 - 2020 period.
The publication presents data on main macroeconomic indicators of the national economy - gross domestic product, investments and finance; and economic activity groupings - industry, agriculture, forestry, ...
Key Indicators for Bulgaria (as of 05.07.2021)
Statistical Reference Book 2021 (Bulgarian version)
The Statistical Reference Book presents topical information on the demographic processes as well as the economic, social and cultural development of the Republic of Bulgaria for the 2016 - 2020 period.
The publication presents data on main macroeconomic indicators of the national economy - gross domestic product, investments and finance; and economic activity groupings - industry, agri...
Statistical Yearbook 2020
It provides current statistical information about the demographic, economic and social development of the country for 2014 - 2019 in different territorial and classification aggregations and breakdowns.
According to the Law on Statistics, official source of information in the Republic of Bulgaria is the ...
Key Indicators for Bulgaria (as of 05.04.2021)
Structure of Earnings 2018
The National Statistical Institute (NSI) of Bulgaria presents to the users of statistical information the publication ‘Structure of Earnings 2018’. It contains data from the representative Structure of Earnings Survey for 2018 (SES 2018) carried out by the NSI. The SES 2018 is the fifth of a series of four-yearly surveys to be conducted under the Council Regulation (EC) No. 530/1999, the Commission Regulation (EC) No. 1916/2000 (amended) and the Commission Regulation (EC) No. 1738/2005. The objective of this legislation is to provide accurate and harmonized data on earnings in EU Member Sta...
Statistical Yearbook 2012
Key Indicators for Bulgaria (as of 31.12.2020)
Key Indicators for Bulgaria (as of 05.10.2020)
Employment and Unemployment - annual data 2019
The bilingual (Bulgarian-English) publication presents annual average data from the Labour force survey. The Labour force survey is a sample statistical survey on households for examination of the economic activity of the population aged 15 years and over.
The methodology of the survey has been developed according to ILO and Eurostat recommendations.
Key Indicators for Bulgaria (as of 06.07.2020)
Statistical Reference Book 2020
The Statistical Reference Book presents topical information on the demographic processes as well as the economic, social and cultural development of the Republic of Bulgaria for the 2016 - 2019 period.
The publication presents data on main macroeconomic indicators of the national economy - gross domestic product, investments and finance; and economic activity groupings - industry, agriculture, forestry, ...
Statistical Reference Book 2020 (Bulgarian version)
The Statistical Reference Book presents topical information on the demographic processes as well as the economic, social and cultural development of the Republic of Bulgaria for the 2016 - 2019 period.
The publication presents data on main macroeconomic indicators of the national economy - gross domestic product, investments and finance; and economic activity groupings - industry, agriculture,...
Statistical Yearbook 2019
It provides current statistical information about the demographic, economic and social development of the country for 2013 - 2018 in different territorial and classification aggregations and breakdowns.
According to the Law on Statistics, official source of information in the Republic of Bulgaria is the ...
Key Indicators for Bulgaria (as of 06.04.2020)
Key Indicators for Bulgaria (as of 31.12.2019)
Key Indicators for Bulgaria (as of 04.10.2019)
Employment and Unemployment - annual data 2018
The bilingual (Bulgarian-English) publication presents annual average data from the Labour force survey. The Labour force survey is a sample statistical survey on households for examination of the economic activity of the population aged 15 years and over.
The methodology of the survey has been developed according to ILO and Eurostat recommendations.
Key Indicators for Bulgaria (as of 05.07.2019)
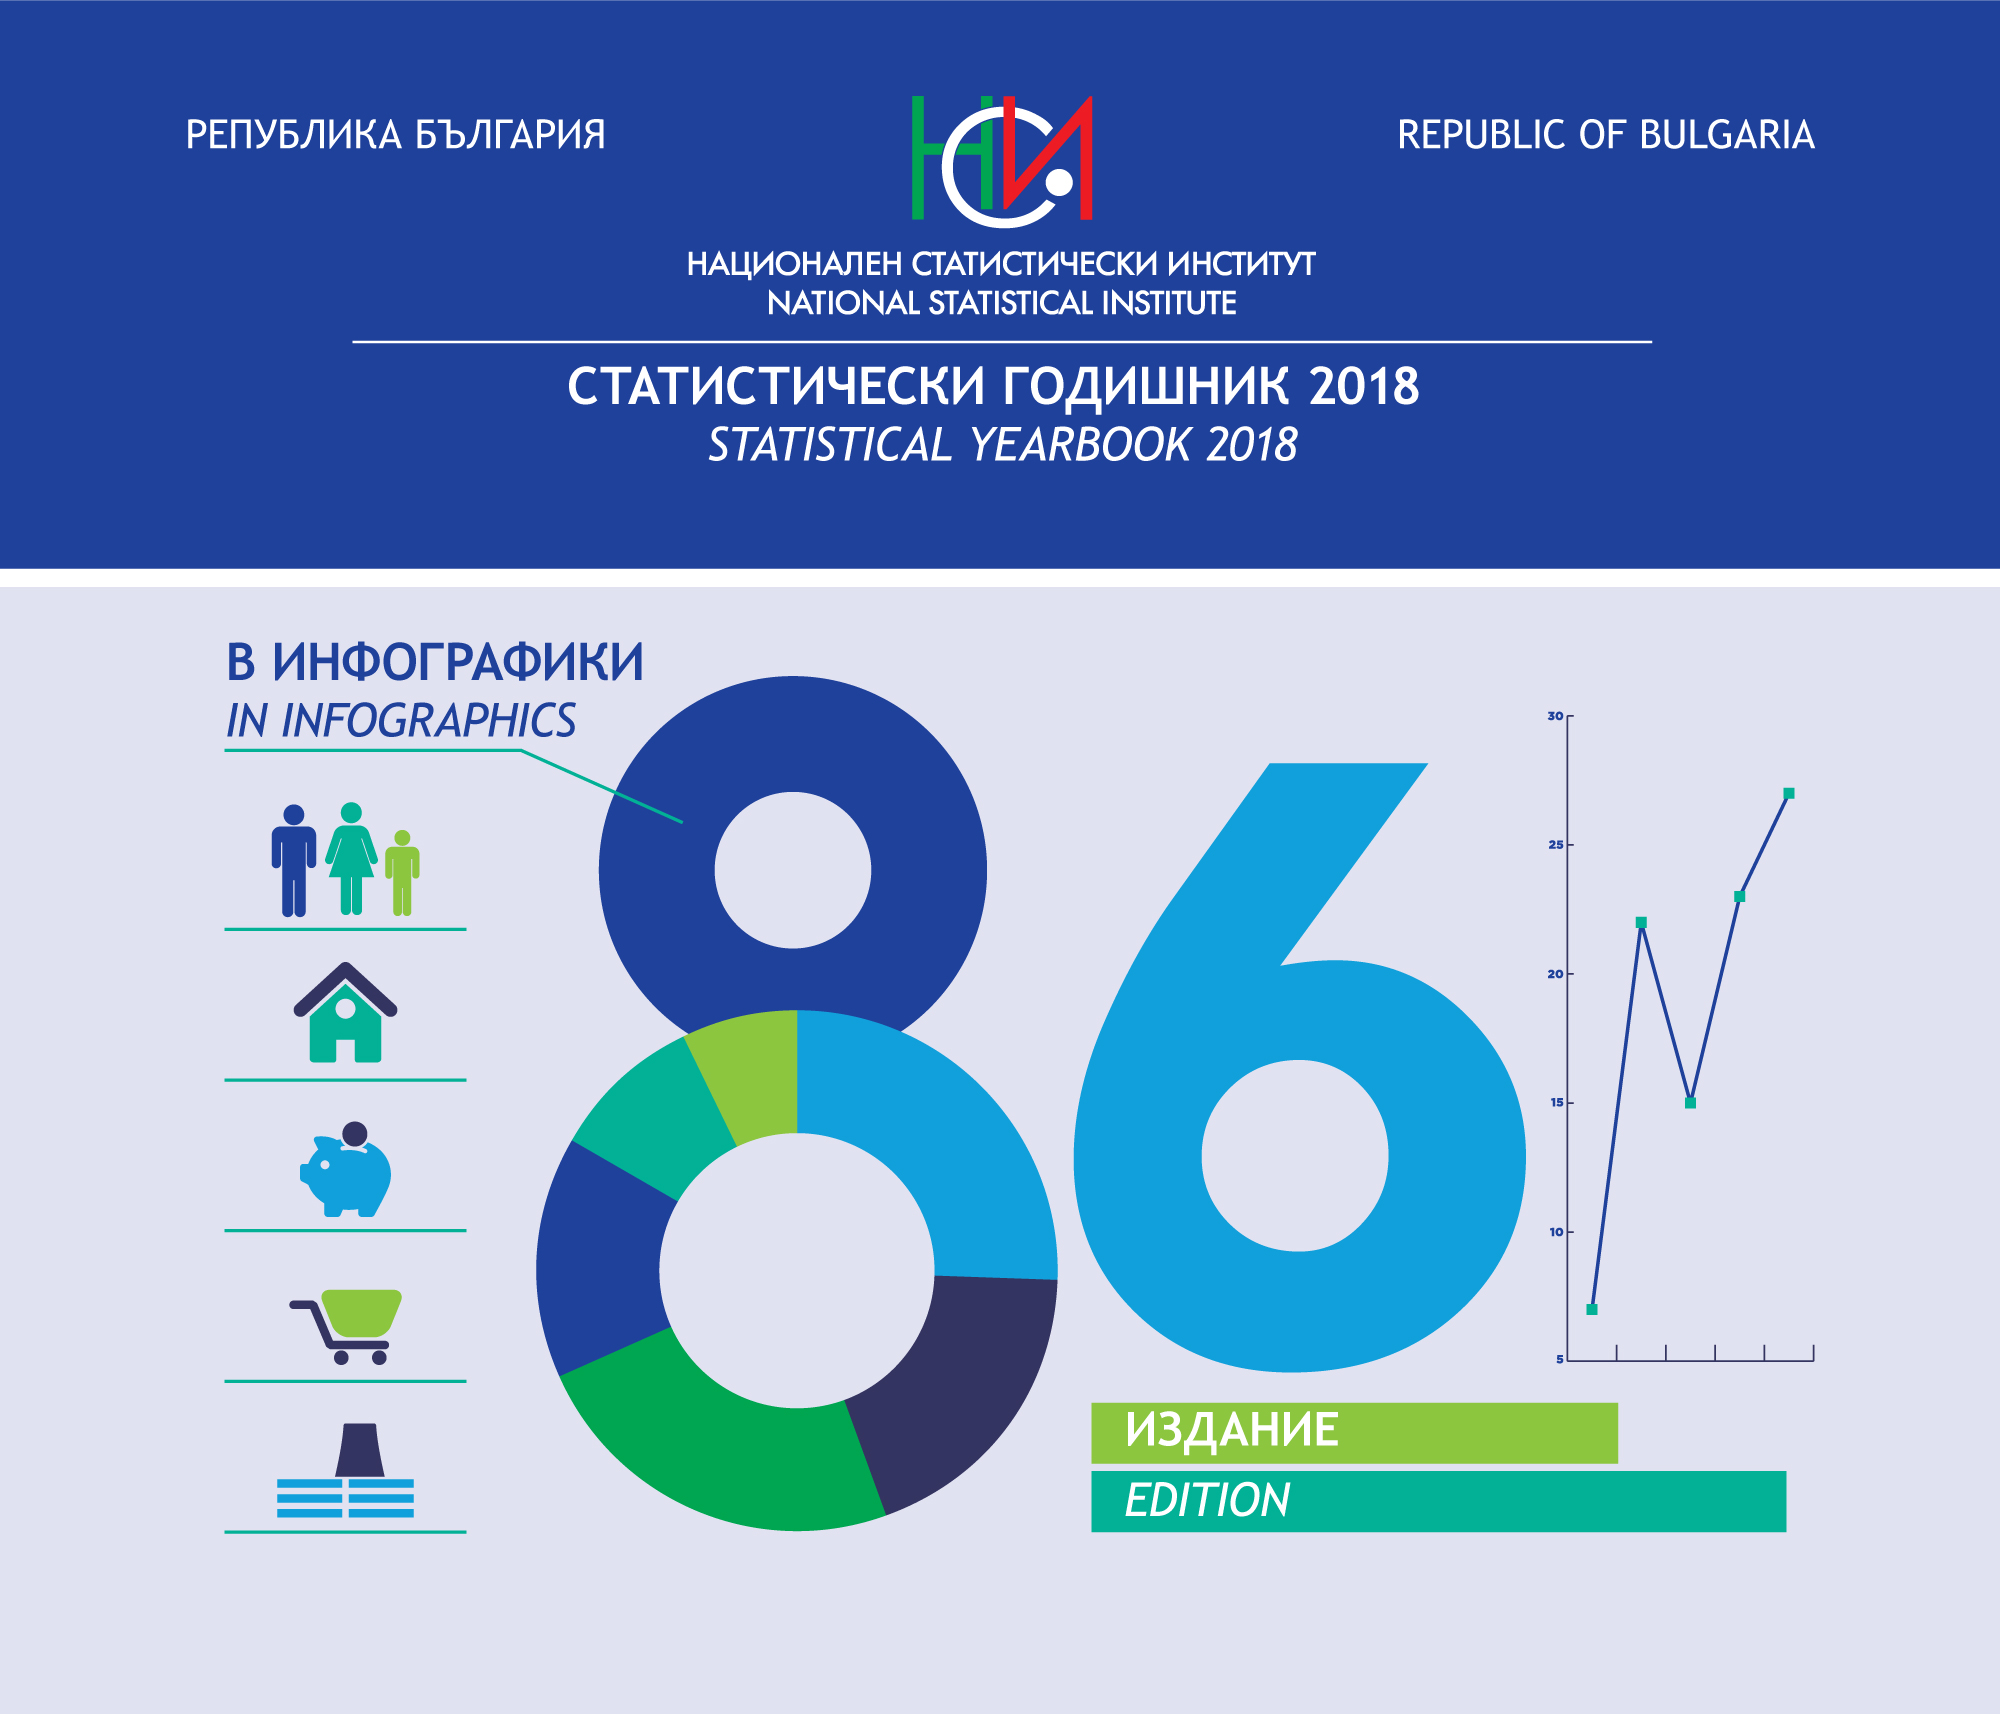
Statistical Yearbook 2018 in infographics
In 2018, for the first time, we presented the results of the statistical surveys through graphics, images and other visualization tools, which resulted in a positive response among a wide range of users. We believe that this modern way of presenting statistical information will trigger the interest in those who for the first time encounter the meaning of numbers revealing important aspects of socio-economic life.
...Statistical Reference Book 2019
The Statistical Reference Book presents topical information on the demographic processes as well as the economic, social and cultural development of the Republic of Bulgaria for the 2015 - 2018 period.
The publication presents data on main macroeconomic indicators of the national economy - gross domestic product, investments and finance; and economic activity groupings - industry, agriculture, f...
Statistical Reference Book 2019 (Bulgarian version)
The Statistical Reference Book presents topical information on the demographic processes as well as the economic, social and cultural development of the Republic of Bulgaria for the 2015 - 2018 period.
The publication presents data on main macroeconomic indicators of the national economy - gross domestic product, investments and finance; and economic activity groupings - industry, agriculture, forestry, transp...
Statistical Yearbook 2018
It provides current statistical information about the demographic, economic and social development of the country for 2012 - 2017 in different territorial and classification aggregations and breakdowns.
According to the Law on Statistics, official source of information in the Republic of Bulgaria is the ...
Key Indicators for Bulgaria (as of 05.04.2019)
Key Indicators for Bulgaria (as of 28.12.2018)
Key Indicators for Bulgaria (as of 05.10.2018)
Employment and Unemployment - annual data 2017
The bilingual (Bulgarian-English) publication presents annual average data from the Labour force survey. The Labour force survey is a sample statistical survey on households for examination of the economic activity of the population aged 15 years and over.
The methodology of the survey has been developed according to ILO and Eurostat recommendations.
The publication contains:
Key Indicators for Bulgaria (as of 06.07.2018)
Statistical Reference Book 2018
The Statistical Reference Book presents topical information on the demographic processes as well as the economic, social and cultural development of the Republic of Bulgaria for the 2014 - 2017 period.
The publication presents data on main macroeconomic indicators of the national economy - gross domestic product, investments and finance; and economic activity groupings - industry, agriculture, f...
Statistical Yearbook 2017 in infographics
The publication is intended for a wider audience as statistical data are presented in a plain and easy understandable way.
The current state and changes in the socio-economic and cultural life in the country are presented not in the traditional way in tables and text, but through infographics - images, graphics and other visualization tools.
We belie...
Statistical Reference Book 2018 (Bulgarian version)
The Statistical Reference Book presents topical information on the demographic processes as well as the economic, social and cultural development of the Republic of Bulgaria for the 2014 - 2017 period.
The publication presents data on main macroeconomic indicators of the national economy - gross domestic product, investments and finance; and economic activity groupings - industry, agriculture, forestry, transp...
Statistical Yearbook 2017
It provides current statistical information about the demographic, economic and social development of the country for 2012 - 2016 in different territorial and classification aggregations and breakdowns.
According to the Law on Statistics, official source of information in the Republic of Bulgaria is the ...
Key Indicators for Bulgaria (as of 05.04.2018)
Key Indicators for Bulgaria (as of 29.12.2017)
Key Indicators for Bulgaria (as of 06.10.2017)
Employment and Unemployment - annual data 2016
The bilingual (Bulgarian-English) publication presents annual average data from the Labour force survey. The Labour force survey is a sample statistical survey on households for examination of the economic activity of the population aged 15 years and over.
The methodology of the survey has been developed according to ILO and Eurostat recommendations.
Key Indicators for Bulgaria (as of 06.07.2017)
Statistical Reference Book 2017
The Statistical Reference Book presents topical information on the demographic processes as well as the economic, social and cultural development of the Republic of Bulgaria for the 2013 - 2016 period.
The publication presents data on main macroeconomic indicators of the national economy - gross domestic product, investments and finance; and economic activity groupings - industry, agriculture, f...
Statistical Reference Book 2017 (Bulgarian version)
The Statistical Reference Book presents topical information on the demographic processes as well as the economic, social and cultural development of the Republic of Bulgaria for the 2013 - 2016 period.
The publication presents data on main macroeconomic indicators of the national economy - gross domestic product, investments and finance; and economic activity groupings - industry, agriculture, forestry, transp...
Statistical Yearbook 2016
It provides current statistical information about the demographic, economic and social development of the country for 2011 - 2015 in different territorial and classification aggregations and breakdowns.
According to the Law on Statistics, official source of information in the Republic of Bulgaria is the ...
Key Indicators for Bulgaria (as of 06.04.2017)
Structure of Earnings 2014
Key Indicators for Bulgaria (as of 30.12.2016)
Key Indicators for Bulgaria (as of 06.10.2016)
Key Indicators for Bulgaria (as of 06.07.2016)
Employment and Unemployment - annual data 2015
The bilingual (Bulgarian-English) publication presents annual average data from the Labour force survey. The Labour force survey is a sample statistical survey on households for examination of the economic activity of the population aged 15 years and over.
The methodology of the survey has been developed according to ILO and Eurostat recommendations.
Labour Force Survey Leaflet
It provides information of economic activity of the population - employment and unemployment, according to the internationally adopted concepts and definitions. Some of t...
Statistical Reference Book 2016
The Statistical Reference Book presents topical information on the demographic processes as well as the economic, social and cultural development of the Republic of Bulgaria for the 2012 - 2015 period.
The publication presents data on main macroeconomic indicators of the national economy - gross domestic product, investments and finance; and economic activity groupings - industry, agriculture, forestry, transpor...
Statistical Reference Book 2016 (Bulgarian version)
The Statistical Reference Book presents topical information on the demographic processes as well as the economic, social and cultural development of the Republic of Bulgaria for the 2012 - 2015 period.
The publication presents data on main macroeconomic indicators of the national economy - gross domestic product, investments and finance; and economic activity groupings - industry, agriculture, forestry, transp...
Statistical Yearbook 2015
It provides current statistical information about the demographic, economic and social development of the country for 2010 - 2014 in different territorial and classification aggregations and breakdowns.
According to the Law on Statistics, official source of information in the Republic of Bulgaria is the ...
Key Indicators for Bulgaria (as of 06.04.2016)
Key Indicators for Bulgaria (as of 30.12.2015)
Key Indicators for Bulgaria (as of 05.10.2015)
Employment and Unemployment - annual data 2014
The National Statistical Institute presents to users the annual electronic publication Employment and Unemployment - annual data 2014.
The bilingual (Bulgarian-English) issue includes annual average data from the Labour Force Survey. This survey is a sample statistical survey on households for examination of the economic activity of the population aged 15 years and over.
The methodology of the survey has been developed according to ILO and Eurostat recommendations.
Key Indicators for Bulgaria (as of 02.07.2015)
Statistical Reference Book 2015
The National Statistical Institute presents to users of statistical information the annual publication - Statistical Reference Book 2015 in English.
The Statistical Reference Book presents topical information on the demographic processes as well as the economic, social and cultural development of the Republic of Bulgaria for the 2010 - 2014 period.
The publication presents data on main macroeconomic indicators of the national economy - gross domestic product, investments and finance; and economic activity groupings - industry, agriculture, forestry, transport, c...
Statistical Reference Book 2015 (Bulgarian version)
The National Statistical Institute presents to users of statistical information the annual publication - Statistical Reference Book 2015 in Bulgarian.
The Statistical Reference Book presents topical information on the demographic processes as well as the economic, social and cultural development of the Republic of Bulgaria for the 2010 - 2014 period.
The publication presents data on main macroeconomic indicators of the national economy - gross domestic product, investments and finance; and economic activity groupings - industry, agriculture, forestry, transport,...
Statistical Yearbook 2014
The National Statistical Institute (NSI) has the pleasure to present to the attention of national and foreign users of statistical information the 82nd edition of the ‘Statistical Yearbook of the Republic of Bulgaria’ in printed and electronic format.
It provides current statistical information about the demographic, economic and social development of the country for 2009 - 2013 in different territorial and classification aggregations and breakdowns.
According to the Law on Statistics, official source of information in the Republic of Bulgaria is the Nati...
Key Indicators for Bulgaria (as of 02.04.2015)
Key Indicators for Bulgaria (as of 30.12.2014)
Key Indicators for Bulgaria (as of 01.10.2014)
Employment and Unemployment - annual data 2013
Key Indicators for Bulgaria (as of 02.07.2014)
Statistical Reference Book 2014
The National Statistical Institute presents to users of statistical information the annual publication - Statistical Reference Book 2014 in English.
The Statistical Reference Book presents topical information on the demographic processes as well as the economic, social and cultural development of the Republic of Bulgaria for the 2009 - 2013 period.
The publication presents data on main macroeconomic indicators of the national economy - gross domestic product, investments and finance; and economic activity groupings - industry, agriculture, forestry, tran...
Statistical Reference Book 2014 (Bulgarian version)
The National Statistical Institute presents to users of statistical information the annual publication - Statistical Reference Book 2014 in Bulgarian.
The Statistical Reference Book presents topical information on the demographic processes as well as the economic, social and cultural development of the Republic of Bulgaria for the 2009 - 2013 period.
The publication presents data on main macroeconomic indicators of the national economy - gross domestic product, investments and finance; and economic activity groupings - industry, agriculture, forestry, tr...
Statistical Yearbook 2013
The National Statistical Institute (NSI) has the pleasure to present to the attention of national and foreign users of statistical information the 81st edition of the ‘Statistical Yearbook of the Republic of Bulgaria’ in printed and electronic format.
It provides current statistical information about the demographic, economic and social development of the country for 2008 - 2012 in different territorial and classification aggregations and breakdowns.
According to the Law on Statistics, official source of information in the Republic of Bulgaria is the Nati...


