Persons convicted by sex - number, structure and rate per 100 000 persons of criminaly responsible population (14 years and above)
Time series : JST_3.6_en.xls
| Year | Number | Structure - % | Rate1 | ||||||
|---|---|---|---|---|---|---|---|---|---|
| Total | Male | Female | Total | Male | Female | Total | Male | Female | |
| 2019 | 23 389 | 21 496 | 1 893 | 100.0 | 91.9 | 8.1 | 388 | 742 | 61 |
| 2020 | 21 889 | 19 884 | 2 005 | 100.0 | 90.8 | 9.2 | 365 | 691 | 64 |
| 2021 | 24 121 | 22 107 | 2 014 | 100.0 | 91.7 | 8.3 | 406 | 775 | 66 |
| 2022 2 | 24 047 | 21 973 | 2 074 | 100.0 | 91.4 | 8.6 | 428 | 822 | 70 |
| 2023 | 23 037 | 21 167 | 1 870 | 100.0 | 91.9 | 8.1 | 411 | 794 | 64 |
1 Persons convicted per 100 000 persons of of the average annual population aged 14 and over. |
|||||||||
| 2 There is a break in the time series for all coefficients since 2022 due to the availability of a new population estimate based on 2021 Census data. | |||||||||
15.07.2024
| Contact | |
|---|---|
| Contact organisation | The National Statistical Institute |
| Contact organisation unit | „Health Care and Justice Statistics“ Department |
| Contact name | Diana Savcheva |
| Contact person function | Chief expert |
| Contact mail address | 2, P. Volov Str.; 1038 Sofia, Bulgaria |
| Contact email address | |
| Contact phone number | +359 2 9857 561 |
| Contact fax number | |
| Metadata update | |
| Metadata last certified | 15 July 2024 |
| Metadata last posted | 15 July 2024 |
| Metadata last update | 15 July 2024 |
| Statistical presentation | |
| Data description | Statistics of Crimes, accused and convicted persons ensures data on:
|
| Classification system |
|
| Sector coverage | Covers the activity of regional and district courts within the territory of the country on penal trials of general, private and administrative nature. Since 1998 is included the information for the activity of military courts and form 2012 to 2022 - of the Specialized criminal court. According to the Judiciary System Act (amended and supplemented by SG 32 of 26 April 2022), the Specialized Criminal Court is abolished. Criminal cases of first instance before the Specialised Criminal Court, in which a dispositional hearing has been held, become subject to the jurisdiction of the Sofia City Court and their examination continues by the panel of judges which held the hearing. The judges of the Trial Chambers who have not been reassigned to the Sofia City Court shall be seconded to take part in the examination of the cases until the conclusion of the proceedings on them. Information on the activities of The Supreme Court of Cassation is not included. |
| Statistical concepts and definitions | The number of crimes, accused and persons convicted includes the information from penal trials with sentence that has come into force during the reference year. Crimes with penalties inflicted include proceedings that finished with conditional or effective sentence irrespective of the number of perpetrators. A crime committed by more than one person (in complicity) is counted as crime with penalty inflicted when at least one of the accused persons is effective or conditional convicted. In case when all persons have been acquitted, a crime committed in complicity ends with acquittal. A crime is counted as suspended when proceeding against the perpetrator or all perpetrators ends with suspension. Crimes with penalty inflicted by place of commitment are distributed by districts and municipalities in accordance with the administrative-territorial division of the country. Crimes committed abroad which are under the jurisdiction of courts in the Republic of Bulgaria are included in the total number of crimes. Accused persons include effective and conditionally sentenced persons, as well as acquitted persons, persons released from penalty, and persons against whom the proceedings have been suspended. Persons convicted are those with effective or conditional sentence has come into force. The age of persons convicted is in completed years by the date of commitment of the crime. Persons who have completed 14 years of age, but not 18 years are considered as juveniles. When a crime is committed by several persons, the crime is counted only once, and each perpetrator - individually depending on the results of proceeding. In case there is convicted person for more than one committed crime in one proceeding, the most severe punishment is counted. If a person is convicted for several crimes, the person is counted as the most serious punishable offence and each crime separately according to the respective type of crime. When in one proceeding, a person is convicted for several crimes committed in different places in the country, the person is counted by the place of commitment for the most severe punishable crime by districts and municipalities in accordance with the administrative-territorial division of the country. The number of accused and persons convicted does not coincide with the actual number, as during the calendar year, a person may be accused or convicted more than once. The population estimate as of 31 December 2022 reflects the changes in population numbers and structure recorded in the Census 2021. In this regard, there is a break in the time series for all coefficients since 2022. |
| Statistical unit | The object of the survey is the activity of the regional, district, military courts and the Specialized criminal court on penal trials of general, private and administrative nature. Units of survey are crimes, accused and persons convicted with sentence that has come into force during the reference year. |
| Statistical population | Covers all courts within the territory of the country that are include in the coverage of the survey. |
| Reference area | The Republic of Bulgaria's territory. |
| Time coverage | By 2003 - only published data are available. 2004 - 2023 - the data are available on the website www.nsi.bg, in the INFOSTAT Information System (https://infostat.nsi.bg/infostat/pages/module.jsf?x_2=56 ) and on request. |
| Base period | Not applicable. |
| Unit of measure | |
Number. | |
| Reference period | |
Year. | |
| Institutional mandate | |
| Legal acts and other agreements |
|
| Data sharing | The united Eurostat and UNODC questionnaire on crime trends and the functioning of the criminal justice systems (UN-CTS). |
| Confidentiality | |
| Confidentiality - policy |
|
| Confidentiality - data treatment | Individual data are not published in accordance with article 25 of the Law on Statistics. The publishing of individual data can be performed only in accordance with article 26 of the same law. |
| Release policy | |
| Release calendar | Statistical information publication date is indicated in the Release Calendar presenting the results of the statistical surveys carried out by the NSI. Data are disseminated once in the year. |
| Release calendar access | The Release Calendar is available on the NSI website: https://www.nsi.bg/en/node/480 |
| User access | Data on Crimes, accused and persons convicted is published on the NSI website, section Justice and crime in accordance with the Statistics Act and the European Statistics Code of Practice respecting the professional independence and aimed at objectivity, transparency and equal treatment of all consumers. |
| Frequency of dissemination | |
Annually. | |
| Accessibility and clarity | |
| News release | Annually as the date is indicated in the Release Calendar presenting the results of the statistical surveys carried out by the NSI. |
| Publications |
|
| On-line database | Data on Crimes, accused and persons convicted are available to all users of the NSI website under the section Justice and crime as well as in Informational System INFOSTAT. |
| Micro-data access | Anonymised individual data can be provide for scientific and research purposes, and for individual request according to the Rules for the provision of anonymised individual data for scientific and research purposes. |
| Other | Information service on request, according to the Rules for the dissemination of statistical products and services in NSI. |
| Documentation on methodology |
|
| Quality documentation | Not available. |
| Quality management | |
| Quality assurance | The criteria for the quality of the statistical data are provided. There is a quality management system in the BNSI in accordance with the requirements of ISO 9001:2015. Since 2019, an extended scope of the system has been approved, including receiving, data collection, processing, storing, analysing, providing and dissemination of statistical information. The main source of information is the Unified Information System for Counteraction to Criminality (UISCC). The other source is a statistical questionnaire form of the NSI „Card for accused person”, filled in by the pre-trial and trial proceedings. In recent years, the UISCC has been the source of about 90 - 94 % of primary data for the whole country, which is a significant guarantee of high data quality. |
| Quality assessment | The quality management system certified in accordance with ISO 9001:2015, application of the uniform methodological documents, rules and procedures at all stages of the study ensure high quality of the data. |
| Relevance | |
| User needs | The needs are determined by conducting a policy of prevention of criminality in the country and society` need of information on trends in the field of punished criminality. |
| User satisfaction | Not applicable. |
| Completeness | Full coverage of the statistical units. |
| Accuracy and reliability | |
| Overall accuracy | Not applicable. |
| Sampling error | Not applicable. |
| Non-sampling error | Not applicable. |
| Timeliness and punctuality | |
| Timeliness | T+6 months. |
| Punctuality | Data are disseminated according to the Release Calendar presenting the results of the statistical surveys carried out by the NSI. |
| Coherence and comparability | |
| Comparability - geographical | Data are comparable. |
| Comparability - over time | Information on the activities of military courts has been included since 1998, and from 2012 to 2022 - for the Specialized Criminal Court. Since 2009, data from an administrative source - UISCC - have also been used. |
| Coherence - cross domain | Not applicable. |
| Coherence - internal | Not applicable. |
| Cost and burden | |
Not applicable. | |
| Data revision | |
| Data revision - policy | Not applicable. |
| Data revision - practice | Not applicable. |
| Statistical processing | |
| Source data | Data source for on punished crime are:
|
| Frequency of data collection | Annually. |
| Data collection | Monthly:
Annually:
|
| Data validation | Data validation is performed:
|
| Data compilation | Data are processed centralized, at national level. |
| Adjustment | Not applicable. |
| Comment | |
Download in SDMX 2.1 file format: Crimes, accused and persons convicted
Metadata Structure Definition in SDMX 2.1: ESMS_MSD+BNSI+2.0+SDMX.2.1.xml
Download in SDMX 2.0 file format: Crimes, accused and persons convicted
Metadata Structure Definition in SDMX 2.0: ESMS_MSD+BNSI+2.0+SDMX.2.0.xml
Anti-Social Acts and Crimes of Minors and Juveniles in 2024
The number of minors and juveniles registered in the Child pedagogic rooms (CPRs) for anti-social acts and crimes committed in 2024 was 8 430. In comparison with 2023, their number decreased by 90 persons, or by 1.1%.
The number of minors and juveniles new entrants in the CPRs in 2024 was 2 699, and 2 594 persons were removed from the CPRs.
The minors and juveniles who passed through the CPRs for committed antisocial acts were 5 609, and for crimes - 4 835.
...Crimes, accused persons and persons convicted in 2023
In 2023 with effective and conditional sentences were concluded 25 169 crimes and convicted persons were 23 037.
Among the crimes with penalty inflicted, with the highest number and share were generally dangerous crimes - 12 543 (49.8%) for which 11 022 persons were convicted (47.8% of the total number of convicted persons). The second place in the structure were the crimes against the property - 4 748 (18.9%) with 5 069 convicted persons (22.0%).
In the distribution of crimes with an inflicted penalty by the numb...
Anti-Social Acts and Crimes of Minors and Juveniles in 2023
The number of minors and juveniles registered in the Child pedagogical rooms for anti-social acts and crimes committed in 2023 was 8 520. In comparison with 2022, their number decreased by 106, or by 1.2%.
The number of minors and juveniles new entrants in the Child pedagogical rooms in 2023 was 2 772, and 2 362 persons were removed from the Child pedagogical rooms.
...Crimes, accused persons and persons convicted in 2022
In 2022 with effective and conditional sentences were concluded 26 088 crimes and convicted persons were 24 047. The number of convicted males was 21 973, or 91.4%, and females - 2 074 (8.6%). Among both men and women, the highest share of persons convicted was in the 30 - 39 age group - 27.6% for men and 30.5% for women.
Among the crimes with penalty inflicted, with the highest number and share were generally dangerous crimes - 13 428 (51.5%) for which 11 902 persons were convicted (49.5% of the total number of convicted perso...
Anti-Social Acts and Crimes of Minors and Juveniles in 2022
The number of minors and juveniles registered in the Child pedagogic rooms for anti-social acts and crimes committed in 2022 was 8 626. In comparison with 2021, their number decreased by 181, or by 2.1%.
The number of minors and juveniles new entrants in the Child pedagogic rooms in 2022 was 2 677, and 2 513 persons were removed from the Child pedagogic rooms.
...Survey on gender-based violence EU-GBV, 2021
In response to the growing need for statistical data on the prevalence of violence against women, the National Statistical Institute has joined a project initiated by the European Commission to conduct a survey and provide such information. The aim is to provide reliable, comparable, representative data on the prevalence, frequency, intensity and severity of violence against women at а national level and in the EU Member States, using a common and harmonised methodology.
Data from the survey show that among women aged 18 - 74:
- 11.9% have experienced at least one ...
Crimes, accused persons and persons convicted in 2021
The trials of 25 988 committed crimes were ended with penalties (effective and conditional) in 2021. Convicted persons with inflicted penalties in 2021 were 24 121.
...Anti-Social Acts and Crimes of Minors and Juveniles in 2021
The number of minors and juveniles registered in the Child pedagogic rooms for anti-social acts and crimes commitment in 2021 was 8 807. In comparison with 2020, their number decreased by 92 or by 1.0%.
The number of minors and juveniles new entrants in the Child pedagogic rooms in 2021 was 2 776 and 2 599 persons were removed from the Child pedagogic rooms.
...Crimes, accused persons and persons convicted in 2020
The trials of 23 640 committed crimes were ended with penalties (effective and conditional) in 2020. Persons convicted with penalties inflicted in 2020 were 21 889.
...The National Statistical Institute informs users of justice and crime statistics that final data from the survey ‘Crimes, accused and persons convicted’ in 2020 will be published on 27 August 2021
According to the National Statistical Programme for 2021 and Release Calendar presenting the results of the statistical surveys, final data from the survey ‘Crimes, accused and persons convicted’ should be published on 16 July 2021.
Sources of information for punished criminality are:
- The Unified Information System for Counteraction to Criminality (UISCC) that provides around 90 - 94% of the ...
Anti-Social Acts and Crimes of Minors and Juveniles in 2020
The number of minors and juveniles registered in the Child pedagogic rooms for anti-social acts and crimes commitment in 2020 was 8 899. In comparison with 2019, their number decreased by 268 or by 2.9%.
...Crimes, accused persons and persons convicted in 2019
The trials of 24 962 committed crimes were ended with penalties (effective and conditional) in 2019. Persons convicted with penalties inflicted in 2019 were 23 389.
...Anti-Social Acts of Minor and Juveniles in 2019
The number of minors and juveniles registered in the Child pedagogic rooms for anti-social acts and crimes commitment in 2019 was 9 167. In comparison with 2018, their number increased by 69 or by 0.8%.
...Crimes, accused persons and persons convicted in 2018
The trials of 25 165 committed crimes were ended with penalties (effective and conditional) in 2018. Persons convicted with penalties inflicted in 2018 were 23 973.
...Anti-Social Acts of Minor and Juveniles in 2018
The number of minors and juveniles registered in the Child pedagogic rooms for anti-social acts and crimes commitment in 2018 was 9 098. In comparison with 2017 their number decreased by 48 or by 0.5%.
...Crimes, accused persons and persons convicted in 2017
The trials of 26 753 committed crimes were ended with penalties (effective and conditional) in 2017. Persons convicted with penalties inflicted in 2017 were 25 800.
...Anti-Social Acts of Minor and Juveniles in 2017
The number of minors and juveniles registered in the Child pedagogic rooms for anti-social acts and crimes commitment in 2017 was 9 146. In comparison with 2016 their number increased by 50 or by 0.6%.
...Crimes, accused persons and persons convicted in 2016
The trials of 28 119 committed crimes were ended with penalties (effective and conditional) in 2016. Persons convicted with penalties inflicted in 2016 were 28 301.
...Anti-Social Acts of Minor and Juveniles in 2016
The number of minors and juveniles registered in the Child pedagogic rooms for anti-social acts and crimes commitment in 2016 was 9 096. In comparison with 2015 their number decreased by 500 or 5.2%.
...Crimes, accused persons and persons convicted in 2015
The trials of 26 423 committed crimes were ended with penalties (effective and conditionally). That was 8.5% less in comparison with 2014. The number of persons convicted with penalties came into force was 27 787 in 2015. Compared to 2014 a decrease by 12.8% was observed.
...Anti-Social Acts of Minor and Juveniles in 2015
The number of minors and juveniles registered in the Child pedagogic rooms for anti-social acts and crimes commitment in 2015 was 9 596. In comparison with 2014 their number decreased by 10.9%.
...Crimes, Accused Persons and Persons Convicted in 2014
The trials of 34 182 committed crimes were concluded in 2014. The number of accused persons was 37 504. 31 849 persons were convicted in 2014. Compared to 2013 a decrease by 6.6% was observed.
Crimes Concluded with Penalty Inflicted and Persons Convicted in Second Semester of 2014 (preliminary data)
According to the preliminary data of the National Statistical Institute for the second semester of 2014, the trials ended with inflicted penalty cover 12 256 committed crimes.
The number of accused persons was 15 812. The number of persons convicted with penalties come into force amounted to 13 609 as 680 of them were between 14 -17 years that presents 5.0% of the total number of all convicted persons.
...Anti-Social Acts of Minor and Juveniles in 2014
Revised press-release as of 29.04.2015 1
The number of minors and juveniles registered in the Child pedagogic rooms for anti-social acts and crimes commitment in 2014 was 10 768.
1 Press-release published as of 17.04.2015, 11.00 am. is revised due to data processing error.
Crimes Concluded with Penalty Inflicted and Persons Convicted in First Semester of 2014 (preliminary data)
According to the preliminary data of the National Statistical Institute for the first semester of 2014, the trials ended with inflicted penalty cover 11 208 committed crimes.
The number of persons convicted with penalties come into force amounted to 12 210 as 672 of them were between 14 -17 years that presents 5.5% of the total number of all convicted persons.
...Crimes, Accused Persons and Persons Convicted in 2013 (preliminary data)
According to the National Statistical Institute’s preliminary data, the trials of 37 238 committed crimes were proceeded in 2013. Proceedings of 17 972 crimes were ended with effective sentences, of 13 427 crimes - with conditional sentences, of 1 019 crimes - with acquittal sentences, of 101 crimes - with suspension and of 4 719 crimes - with release of penalty.
Proceedings of 31 399 committed crimes were ended with penalties. That was 8.3% less in comparison with 2012.
The number of accused persons in 2013 was 40 427.
The number of pers...
Crimes Concluded with Penalty Inflicted and Persons Convicted in Second Semester of 2013 (preliminary data)
According to the preliminary data of the National Statistical Institute for the second semester of 2013, the trials ended with inflicted penalty covered 13 274 committed crimes.
The number of accused persons in second half of 2013 was 16 974.
The number of persons convicted with penalties came into force amounted to 14 570, while 777 of them were Juveniles aged 14 - 17 years, that presents 5.3% of the total number of convicted persons.
...Anti-Social Acts of Minor and Juveniles in 2013 (Preliminary Data)
According to the NSI’s preliminary data the number of minors and juveniles registered in the Child pedagogic rooms for anti-social acts and crimes commitment in 2013 was 10 536.
...Crimes Concluded with Penalty Inflicted and Persons Convicted in First Semester of 2013 (preliminary data)
According to the preliminary data of the National Statistical Institute for the first semester of 2013, the trials ended with inflicted penalty cover 12 723 committed crimes.
The number of persons convicted with penalties come into force amounted to 13 905.
...Crimes, Accused Persons and Persons Convicted in 2012
Crimes Concluded with Penalty Inflicted and Persons Convicted in Second Semester of 2012 (preliminary data)
According to the preliminary data of the National Statistical Institute for the second semester of 2012, the trials ended with inflicted penalty cover 14 259 committed crimes.
The number of persons convicted with penalties came into force amounted to 15 943, while 961 of them were Juveniles aged 14-17 years, that presents 6.0% of the total number of convicted persons....
Anti-Social Acts of Minor and Juveniles in 2012 (Preliminary Data)
Crimes Concluded with Penalty Inflicted and Persons Convicted in First Semester of 2012 (preliminary data)
According to the preliminary data of the National Statistical Institute for the first semester of 2012, the trials ended with inflicted penalty cover 14 250 committed crimes.
The number of persons convicted with penalties come into force amounted to 15 711. The number of persons with effective sentence of conviction amounted to 8 755 and conditionally sentenced were 6 956 persons....
Crimes, Accused Persons and Persons Convicted in 2011
In 2011 the trials ended with penalty inflicted cover 36 707 committed crimes. The number of persons convicted with penalties came into force was 41 013. Compared to 2010 an increase of the number of crimes with penalties inflicted and persons convicted was observed by 3.7% and by 5.0% respectively....
Crimes Concluded with Penalty Inflicted and Persons Convicted in Second Semester of 2011 (preliminary data)
According to the preliminary data of the National Statistical Institute for the second semester of 2011, the trials ended with inflicted penalty cover 15 620 committed crimes.
The number of persons convicted with penalties come into force amounted to 17 634, while 1 200 of them were Juveniles aged 14-17 years....
Anti-Social Acts of Minor and Juveniles in 2011 (Preliminary Data)
Crimes Concluded with Penalty Inflicted and Persons Convicted in First Semester of 2011
According to the preliminary data of the National Statistical Institute for the first semester of 2011, the trials ended with inflicted penalty cover 14 136 committed crimes. The number of persons convicted with penalties come into force amounted to 15 796. The number of persons with effective sentence of conviction amounted to 9 276 and conditionally sentenced are 6 520 persons....
Crimes, Accused Persons and Persons Convicted in 2010
In 2010 the trials ended with penalty inflicted cover 35 397 committed crimes. The number of persons convicted with penalties came into force is 39 070. Compared to 2009 a decrease of the number of crimes with penalties inflicted and persons convicted is observed by 5.4% and by 4.4% respectively....
Crimes, Accused Persons and Persons Convicted in Second Semester of 2010
According to the preliminary data of the National Statistical Institute for the second semester of 2010, the number of persons convicted with penalties come into force amounted to 16 052 as in comparison with the same period of 2009 a decrease by 5.5% is observed (See Annex).
The number of accused person is 18 408. At the same time the number of persons with effective sentence of conviction amounted to 9 793 (53.2% of the total number of convicted persons. Conditionally sentenced are 6 259 persons that presents 34.0% of the total number of accused persons.
In second semester of 2010 the ...
Anti-Social Acts of Minor and Juveniles in 2010 (Preliminary Data)
A tendency to regression of the number of minors and juveniles registered in the Child pedagogic rooms by 8.0% is observed in 2010. Their number in 2010 is the smallest for the past few years – 12 108.
The number of minors and juveniles new entrants (for the first time registered) in the Child pedagogic rooms in 2010 is by 0.3% more in comparison with 2009 and amounted to 4 170....
Crimes Concluded with Penalty Inflicted and Persons Convicted in First Semester of 2010
According to the preliminary data of the National Statistical Institute for the first semester of 2010, the trials ended with inflicted penalty cover 14 656 committed crimes, which present 1.4% less in comparison with the same period of 2009. The number of persons convicted with penalties come into force amounted to 15 930. In comparison with the same period of 2009 decrease is observed by 3.4%....
Anti-Social Acts of Minor and Juvenile Persons in 2008
The total number of minors and juveniles new entrants and registered persons at the Child Pedagogic Rooms in 2008 decreases respectively by 6.5% and 7.0% in comparison with 2007. A decrease by 13.4% compared to 2007 of the number of minors and juveniles registered at the Child Pedagogic Rooms as perpetrators of crime is observed. ...
Statistical Reference Book 2024

Тhe National Statistical Institute presents to the users of statistical information the annual publication - Statistical Reference Book 2024 in English.
The Statistical Reference Book presents up-to-date information on the demographic processes as well as the economic, social and cultural development of the Republic of Bulgaria for the 2019 - 2023 period.
The publication presents data on main macroeconomic indicators of the national economy - gross domestic product, investments and finance; and economic acti...
Bulgaria 2024
The National Statistical Institute presents the bilingual (Bulgarian/English) brochure Bulgaria 2024 to the users of statistical information. The brochure is addressed to a wide range of users (international institutions, representatives of business, students, experts etc.) and changes the traditional presentation of statistical information by offering an innovative structure with a parallel translation in English.
The publication contains up-to-date statistical information about the demographic, social and economic development of the country over the 2018 - 2023 ...
Statistical Reference Book 2024 (Bulgarian version)
The National Statistical Institute presents to users of statistical information the annual publication - Statistical Reference Book 2024 in Bulgarian.
The Statistical Reference Book presents up-to-date information on the demographic processes as well as the economic, social and cultural development of the Republic of Bulgaria for the 2019 - 2023 period.
The publication presents data on main macroeconomic indicators of the national economy - gross domestic product, investments and finance; and economic activity groupings - industry, agriculture, forestry,...
Statistical Yearbook 2023
The National Statistical Institute (NSI) has the pleasure to present to the attention of national and foreign users of statistical information the 91-st edition of the ‘Statistical Yearbook of the Republic of Bulgaria’ in printed format.
It provides current statistical information about the demographic, economic and social development of the country for 2017 - 2022 in different territorial and classification aggregations and breakdowns.
According to the Law on Statistics, official source of information in the Republic of Bulgaria is the National Statistical Sys...
Crimes and Persons Convicted 2022
The NSI annual electronic bilingual publication Crimes and Persons Convicted 2022, containing data on crimes with penalty inflicted, accused persons and persons convicted is available for users of statistical information.
The issue includes data about the activity of district, regional and military courts as well as Specialized Criminal Court in penal cases of a general, private and administrative nature. Comparable data on crimes with penalty inflicted, as well as persons convicted with sentences in force for 1991 - 2022 period are also presented.
The i...
Statistical Reference Book 2023 (Bulgarian version)
The National Statistical Institute presents to users of statistical information the annual publication - Statistical Reference Book 2023 in Bulgarian.
The Statistical Reference Book presents topical information on the demographic processes as well as the economic, social and cultural development of the Republic of Bulgaria for the 2018 - 2022 period.
The publication presents data on main macroeconomic indicators of the national economy - gross domestic product, investments and finance; and economic activity groupings ...
Statistical Reference Book 2023
The National Statistical Institute presents to users of statistical information the annual publication - Statistical Reference Book 2023 in English.
The Statistical Reference Book presents topical information on the demographic processes as well as the economic, social and cultural development of the Republic of Bulgaria for the 2018 - 2022 period.
The publication presents data on main macroeconomic indicators of the national economy - gross domestic product, investments and finance; and economic activity groupings - industry, agriculture, fore...
Statistical Yearbook 2022
The National Statistical Institute (NSI) has the pleasure to present to the attention of national and foreign users of statistical information the 90th edition of the ‘Statistical Yearbook of the Republic of Bulgaria’ in printed format.
It provides current statistical information about the demographic, economic and social development of the country for 2016 - 2021 in different territorial and classification aggregations and breakdowns.
According to the Law on Statistics, official source of information in the Republic of Bulgaria is the National Statistical ...
Crimes and Persons Convicted 2021
The NSI annual electronic bilingual publication Crimes and Persons Convicted 2021, containing data on crimes with penalty inflicted, accused persons and persons convicted is available for users of statistical information.
The issue includes data about the activity of district, regional and military courts as well as Specialized Criminal Court in penal cases of a general, private and administrative nature. Comparable data on crimes with penalty inflicted, as well as persons convicted with sentences in force for 1991 - 2021 period are also presented.
The i...
Statistical Reference Book 2022
The National Statistical Institute presents to users of statistical information the annual publication - Statistical Reference Book 2022 in English.
The Statistical Reference Book presents topical information on the demographic processes as well as the economic, social and cultural development of the Republic of Bulgaria for the 2017 - 2021 period.
The publication presents data on main macroeconomic indicators of the national economy - gross domestic product, investments and finance; and economic activity groupings - industry, agriculture, ...
Bulgaria 2022
The National Statistical Institute presents the bilingual (Bulgarian/English) brochure Bulgaria 2022 to users of statistical information. The brochure is addressed to a wide range of users (international institutions, business, students, experts etc.) and changes the traditional presentation of statistical information by offering an innovative structure with a parallel translation in English. The publication contains topical statistical information about the demographic, social and economic development of the country over the 2016 - 2021 period. It also includes n...
Statistical Reference Book 2022 (Bulgarian version)
The National Statistical Institute presents to users of statistical information the annual publication - Statistical Reference Book 2022 in Bulgarian.
The Statistical Reference Book presents topical information on the demographic processes as well as the economic, social and cultural development of the Republic of Bulgaria for the 2017 - 2021 period.
The publication presents data on main macroeconomic indicators of the national economy - gross domestic product, investments and finance; and economic activity groupings - industry, agriculture, fo...
Statistical Yearbook 2021
The National Statistical Institute (NSI) has the pleasure to present to the attention of national and foreign users of statistical information the 89th edition of the ‘Statistical Yearbook of the Republic of Bulgaria’ in printed and electronic format.
It provides current statistical information about the demographic, economic and social development of the country for 2015 - 2020 in different territorial and classification aggregations and breakdowns.
According to the Law on Statistics, official source of information in the Republic of Bulgaria is the ...
Crimes and Persons Convicted 2020
The NSI annual electronic bilingual publication of the NSI Crimes and Persons Convicted 2020, containing data on crimes with penalty inflicted, accused persons and persons convicted is available for users of statistical information.
The issue includes data about the activity of district, regional and military courts as well as Specialized Criminal Court in penal cases of a general, private and administrative nature. Comparable data on crimes with penalty inflicted, as well as persons convicted with sentences...
Statistical Reference Book 2021
The National Statistical Institute presents to users of statistical information the annual publication - Statistical Reference Book 2021 in English.
The Statistical Reference Book presents topical information on the demographic processes as well as the economic, social and cultural development of the Republic of Bulgaria for the 2016 - 2020 period.
The publication presents data on main macroeconomic indicators of the national economy - gross domestic product, investments and finance; and economic activity groupings - industry, agriculture, forestry, ...
Statistical Reference Book 2021 (Bulgarian version)

The National Statistical Institute presents to users of statistical information the annual publication - Statistical Reference Book 2021 in Bulgarian.
The Statistical Reference Book presents topical information on the demographic processes as well as the economic, social and cultural development of the Republic of Bulgaria for the 2016 - 2020 period.
The publication presents data on main macroeconomic indicators of the national economy - gross domestic product, investments and finance; and economic activity groupings - industry, agri...
Statistical Yearbook 2020
The National Statistical Institute (NSI) has the pleasure to present to the attention of national and foreign users of statistical information the 88th edition of the ‘Statistical Yearbook of the Republic of Bulgaria’ in printed and electronic format.
It provides current statistical information about the demographic, economic and social development of the country for 2014 - 2019 in different territorial and classification aggregations and breakdowns.
According to the Law on Statistics, official source of information in the Republic of Bulgaria is the ...
Bulgaria 2021
The National Statistical Institute presents the bilingual (Bulgarian/English) brochure Bulgaria 2021 to users of statistical information. The brochure is addressed to a wide range of users (international institutions, business, students, experts etc.) and changes the traditional presentation of statistical information by offering an innovative structure with a parallel translation in English. The publication contains topical statistical information about the demographic, social and economic development of the country over the 2015 - 2020 period. It also includes non-traditional i...
Statistical Yearbook 2012

The National Statistical Institute (NSI) has the pleasure to submit to the attention of national and foreign users of statistical information the 80th edition of the ‘Statistical Yearbook of the Republic of Bulgaria’ in printed and electronic format.
It provides current statistical information about the demographic, economic and social development of the country for the 2007 - 2011 period in different territorial and classification aggregations and breakdowns.
Accor...
Crimes and Persons Convicted 2019
The NSI annual electronic bilingual publication of the NSI Crimes and Persons Convicted 2019, containing data on crimes with penalty inflicted, accused persons and persons convicted is available for users of statistical information.
The issue includes data about the activity of district, regional and military courts as well as Specialized Criminal Court in penal cases of a general, private and administrative nature. Comparable data on crimes with penalty inflicted, as well as persons convicted with sentences in force for...
Statistical Reference Book 2020
The National Statistical Institute presents to users of statistical information the annual publication - Statistical Reference Book 2020 in English.
The Statistical Reference Book presents topical information on the demographic processes as well as the economic, social and cultural development of the Republic of Bulgaria for the 2016 - 2019 period.
The publication presents data on main macroeconomic indicators of the national economy - gross domestic product, investments and finance; and economic activity groupings - industry, agriculture, forestry, ...
Statistical Reference Book 2020 (Bulgarian version)
The National Statistical Institute presents to users of statistical information the annual publication - Statistical Reference Book 2020 in Bulgarian.
The Statistical Reference Book presents topical information on the demographic processes as well as the economic, social and cultural development of the Republic of Bulgaria for the 2016 - 2019 period.
The publication presents data on main macroeconomic indicators of the national economy - gross domestic product, investments and finance; and economic activity groupings - industry, agriculture,...
Bulgaria 2020
The National Statistical Institute presents the bilingual (Bulgarian/English) brochure Bulgaria 2020 to users of statistical information. The brochure is addressed to a wide range of users (international institutions, business, students, experts etc.) and changes the traditional presentation of statistical information by offering an innovative structure with a parallel translation in English. The publication contains topical statistical information about the demographic, social and economic development of the country over the 2014 - 2019 period. It also includes non-trad...
Statistical Yearbook 2019
The National Statistical Institute (NSI) has the pleasure to present to the attention of national and foreign users of statistical information the 87th edition of the ‘Statistical Yearbook of the Republic of Bulgaria’ in printed and electronic format.
It provides current statistical information about the demographic, economic and social development of the country for 2013 - 2018 in different territorial and classification aggregations and breakdowns.
According to the Law on Statistics, official source of information in the Republic of Bulgaria is the ...
Crimes and Persons Convicted 2018

The NSI annual electronic bilingual publication of the NSI Crimes and Persons Convicted 2018, containing data on crimes with penalty inflicted, accused persons and persons convicted is available for users of statistical information.
The issue includes data about the activity of district, regional and military courts as well as Specialized Criminal Court in penal cases of a general, private and administrative nature. Comparable data on crimes with penalty inflicted, as well as persons convicted with sentences in force for 1989 - 20...
Statistical Yearbook 2018 in infographics
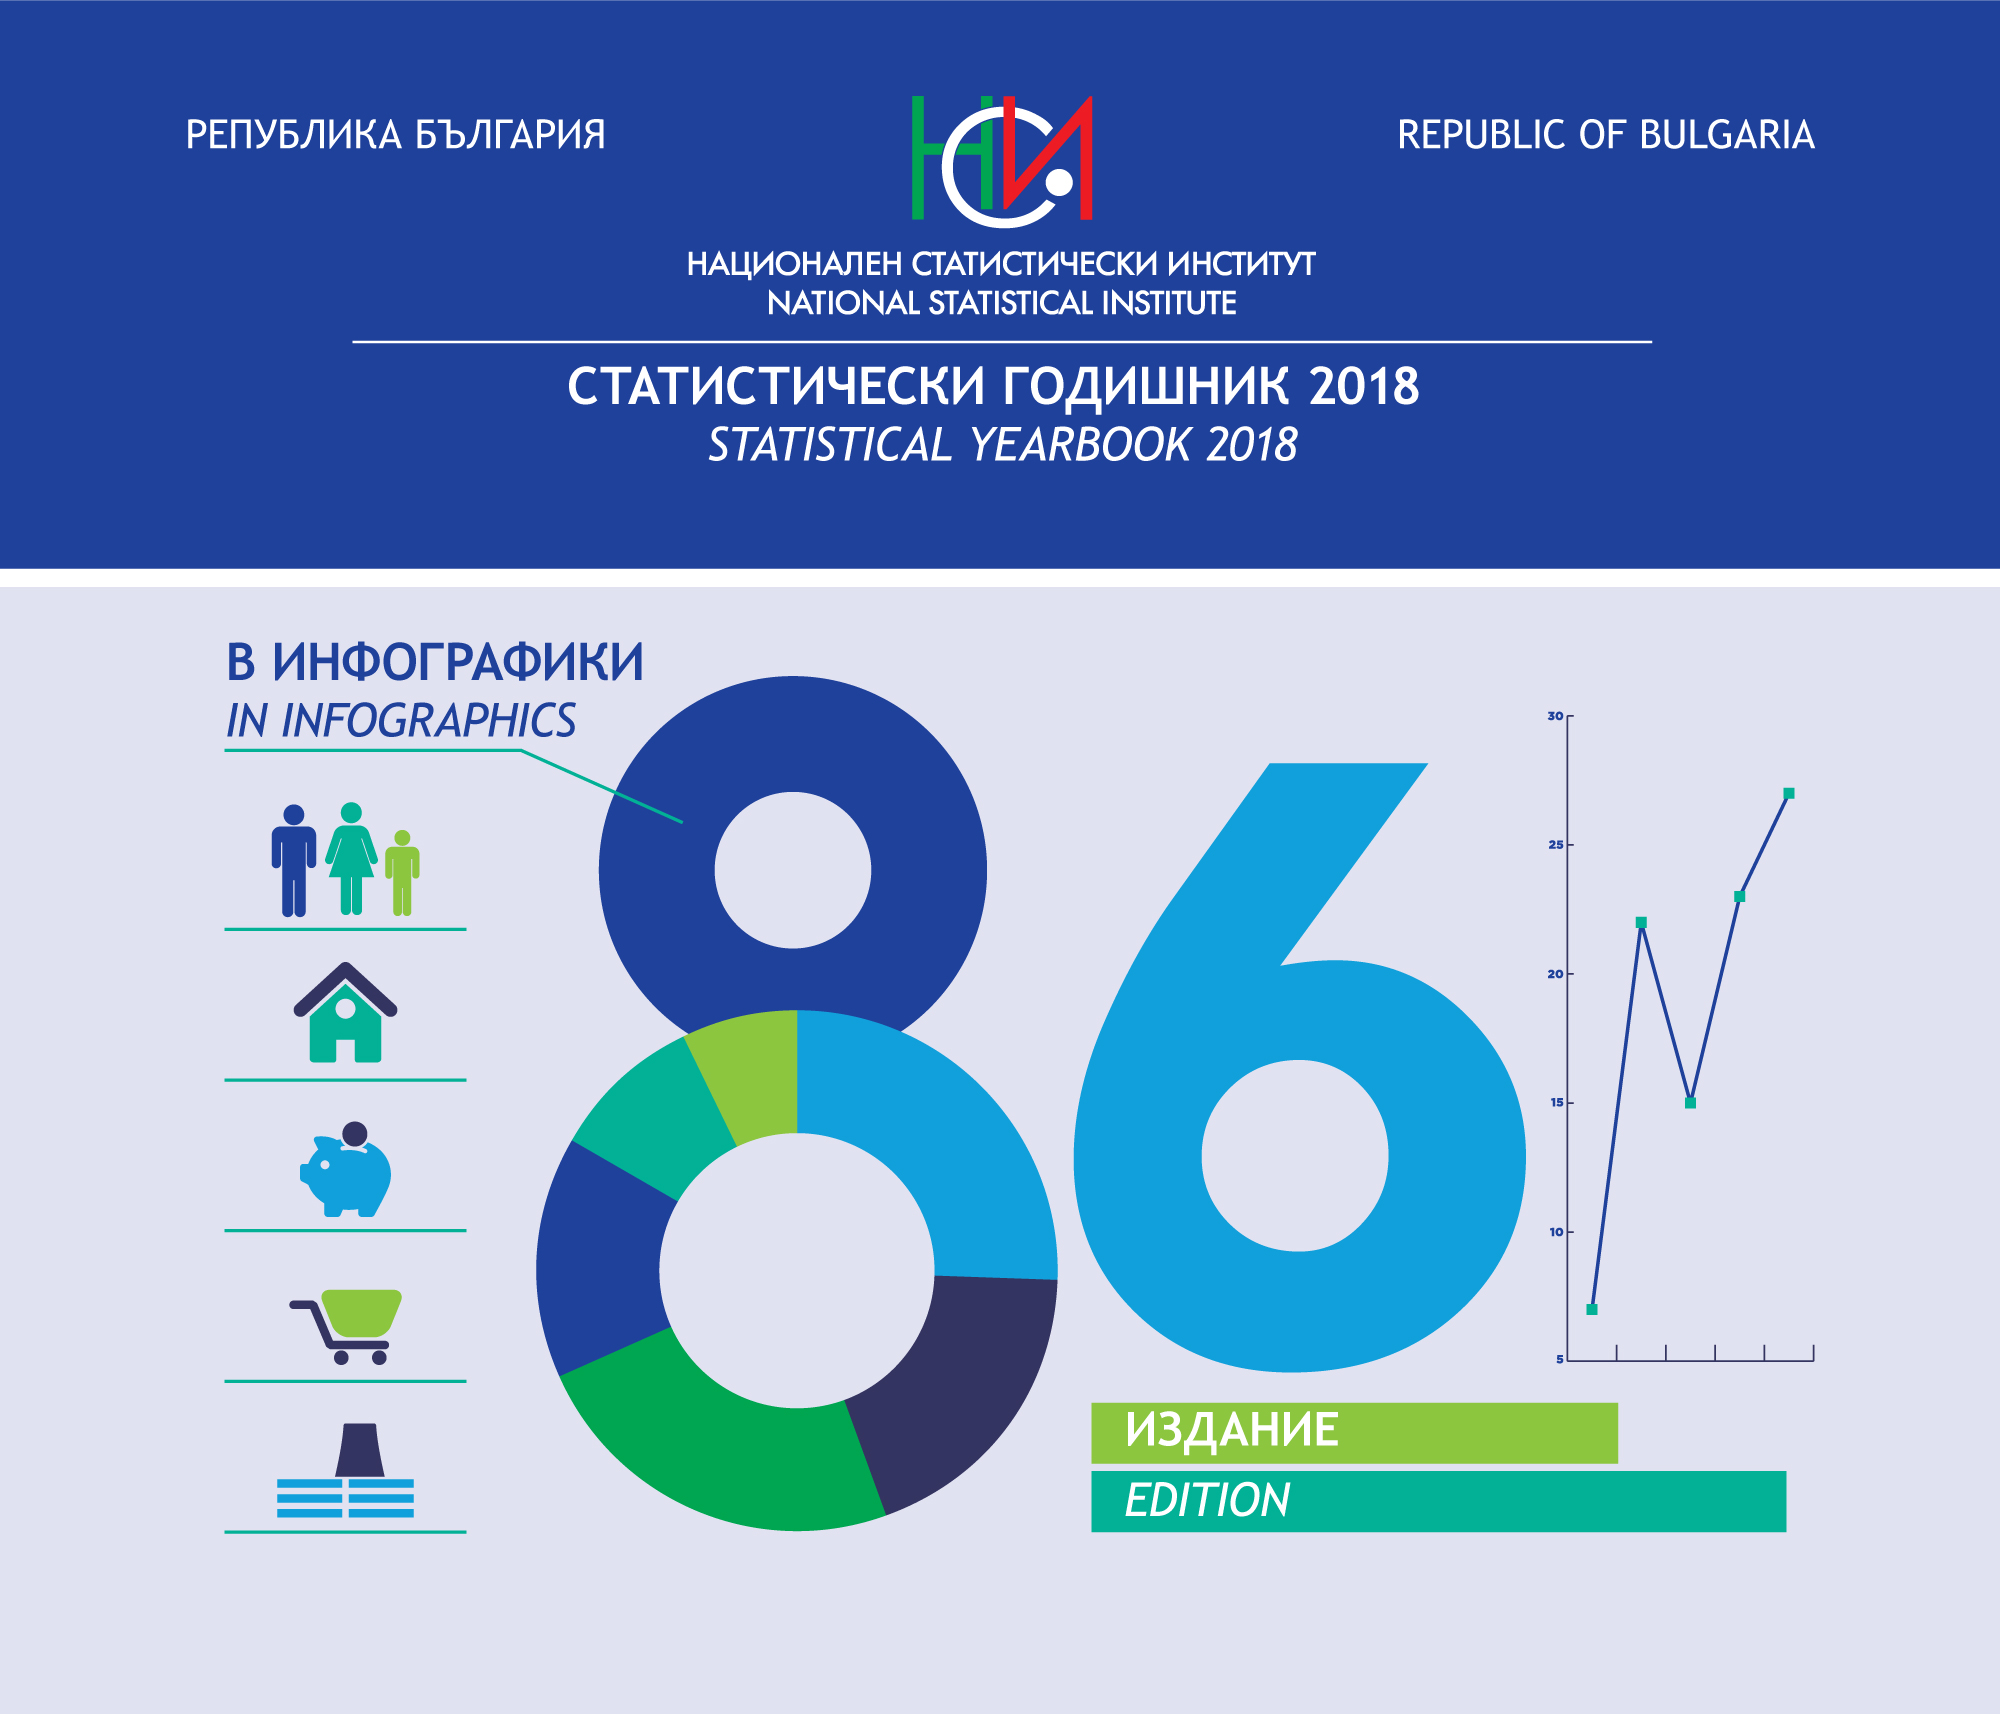
The National Statistical Institute presents to your attention the 86th edition of the Statistical Yearbook of the Republic of Bulgaria in infographics.
In 2018, for the first time, we presented the results of the statistical surveys through graphics, images and other visualization tools, which resulted in a positive response among a wide range of users. We believe that this modern way of presenting statistical information will trigger the interest in those who for the first time encounter the meaning of numbers revealing important aspects of socio-economic life.
...Statistical Reference Book 2019

The National Statistical Institute presents to users of statistical information the annual publication - Statistical Reference Book 2019 in English.
The Statistical Reference Book presents topical information on the demographic processes as well as the economic, social and cultural development of the Republic of Bulgaria for the 2015 - 2018 period.
The publication presents data on main macroeconomic indicators of the national economy - gross domestic product, investments and finance; and economic activity groupings - industry, agriculture, f...
Statistical Reference Book 2019 (Bulgarian version)

The National Statistical Institute presents to users of statistical information the annual publication - Statistical Reference Book 2019 in Bulgarian.
The Statistical Reference Book presents topical information on the demographic processes as well as the economic, social and cultural development of the Republic of Bulgaria for the 2015 - 2018 period.
The publication presents data on main macroeconomic indicators of the national economy - gross domestic product, investments and finance; and economic activity groupings - industry, agriculture, forestry, transp...
Statistical Yearbook 2018

The National Statistical Institute (NSI) has the pleasure to present to the attention of national and foreign users of statistical information the 86th edition of the ‘Statistical Yearbook of the Republic of Bulgaria’ in printed and electronic format.
It provides current statistical information about the demographic, economic and social development of the country for 2012 - 2017 in different territorial and classification aggregations and breakdowns.
According to the Law on Statistics, official source of information in the Republic of Bulgaria is the ...
Crimes and Persons Convicted 2017
The NSI annual electronic bilingual publication of the NSI Crimes and Persons Convicted 2017, containing data on crimes with penalty inflicted, accused persons and persons convicted is available for users of statistical information.
The issue includes data about the activity of district, regional and military courts as well as Specialized Criminal Court in penal cases of a general, private and administrative nature. Comparable data on crimes with penalty inflicted, as well as persons convicted with sentences in force for 1990 - 2017 period are also presented.
<...Statistical Reference Book 2018
The National Statistical Institute presents to users of statistical information the annual publication - Statistical Reference Book 2018 in English.
The Statistical Reference Book presents topical information on the demographic processes as well as the economic, social and cultural development of the Republic of Bulgaria for the 2014 - 2017 period.
The publication presents data on main macroeconomic indicators of the national economy - gross domestic product, investments and finance; and economic activity groupings - industry, agriculture, f...
Statistical Yearbook 2017 in infographics

The National Statistical Institute of Bulgaria offers a different view of the statistical information included in the 85th edition of the Statistical Yearbook of the Republic of Bulgaria.
The publication is intended for a wider audience as statistical data are presented in a plain and easy understandable way.
The current state and changes in the socio-economic and cultural life in the country are presented not in the traditional way in tables and text, but through infographics - images, graphics and other visualization tools.
We belie...
Statistical Reference Book 2018 (Bulgarian version)

The National Statistical Institute presents to users of statistical information the annual publication - Statistical Reference Book 2018 in Bulgarian.
The Statistical Reference Book presents topical information on the demographic processes as well as the economic, social and cultural development of the Republic of Bulgaria for the 2014 - 2017 period.
The publication presents data on main macroeconomic indicators of the national economy - gross domestic product, investments and finance; and economic activity groupings - industry, agriculture, forestry, transp...
Statistical Yearbook 2017
The National Statistical Institute (NSI) has the pleasure to present to the attention of national and foreign users of statistical information the 84th edition of the ‘Statistical Yearbook of the Republic of Bulgaria’ in printed and electronic format.
It provides current statistical information about the demographic, economic and social development of the country for 2012 - 2016 in different territorial and classification aggregations and breakdowns.
According to the Law on Statistics, official source of information in the Republic of Bulgaria is the ...
Bulgaria 2018

The National Statistical Institute presents the bilingual (Bulgarian/English) brochure Bulgaria 2018 to users of statistical information. The brochure is addressed to a wide range of users (international institutions, business, students, experts etc.) and changes the traditional presentation of statistical information by offering an innovative structure with a parallel translation in English. The publication contains topical statistical information about the demographic, social and economic development of the country over the 2013 - 2017 period. It also includes non-trad...
Crimes and Persons Convicted 2016
The NSI annual electronic bilingual publication of the NSI Crimes and Persons Convicted 2016, containing data on crimes with penalty inflicted, accused persons and persons convicted is available for users of statistical information.
The issue includes data about the activity of district, regional and military courts as well as Specialized Criminal Court in penal cases of a general, private and administrative nature. Comparable data on crimes with penalty inflicted, as well as persons convicted with sentences in force for 1990 - 2016 period are also presented.
<...Statistical Reference Book 2017
The National Statistical Institute presents to users of statistical information the annual publication - Statistical Reference Book 2017 in English.
The Statistical Reference Book presents topical information on the demographic processes as well as the economic, social and cultural development of the Republic of Bulgaria for the 2013 - 2016 period.
The publication presents data on main macroeconomic indicators of the national economy - gross domestic product, investments and finance; and economic activity groupings - industry, agriculture, f...
Statistical Reference Book 2017 (Bulgarian version)

The National Statistical Institute presents to users of statistical information the annual publication - Statistical Reference Book 2017 in Bulgarian.
The Statistical Reference Book presents topical information on the demographic processes as well as the economic, social and cultural development of the Republic of Bulgaria for the 2013 - 2016 period.
The publication presents data on main macroeconomic indicators of the national economy - gross domestic product, investments and finance; and economic activity groupings - industry, agriculture, forestry, transp...
Bulgaria 2017
The National Statistical Institute presents the bilingual (Bulgarian/English) brochure Bulgaria 2017 to users of statistical information. The brochure is addressed to a wide range of users (international institutions, business, students, experts etc.) and changes the traditional presentation of statistical information by offering an innovative structure with a parallel translation in English. The publication contains topical statistical information about the demographic, social and economic development of the country over the 2012 - 2016 period. It also includes non-traditional i...
Statistical Yearbook 2016
The National Statistical Institute (NSI) has the pleasure to present to the attention of national and foreign users of statistical information the 84th edition of the ‘Statistical Yearbook of the Republic of Bulgaria’ in printed and electronic format.
It provides current statistical information about the demographic, economic and social development of the country for 2011 - 2015 in different territorial and classification aggregations and breakdowns.
According to the Law on Statistics, official source of information in the Republic of Bulgaria is the ...
Crimes and Persons Convicted 2015

The NSI annual electronic bilingual publication of the NSI Crimes and Persons Convicted 2015, containing data on crimes with penalty inflicted, accused persons and persons convicted is available for users of statistical information.
The issue includes data about the activity of district, regional and military courts as well as Specialized Criminal Court in penal cases of a general, private and administrative nature. Comparable data on crimes with penalty inflicted, as well as persons convicted with sentences in force for 1989 - 2015 period are also presented.
<...Statistical Reference Book 2016

The National Statistical Institute presents to users of statistical information the annual publication - Statistical Reference Book 2016 in English.
The Statistical Reference Book presents topical information on the demographic processes as well as the economic, social and cultural development of the Republic of Bulgaria for the 2012 - 2015 period.
The publication presents data on main macroeconomic indicators of the national economy - gross domestic product, investments and finance; and economic activity groupings - industry, agriculture, forestry, transpor...
Statistical Reference Book 2016 (Bulgarian version)
The National Statistical Institute presents to users of statistical information the annual publication - Statistical Reference Book 2016 in Bulgarian.
The Statistical Reference Book presents topical information on the demographic processes as well as the economic, social and cultural development of the Republic of Bulgaria for the 2012 - 2015 period.
The publication presents data on main macroeconomic indicators of the national economy - gross domestic product, investments and finance; and economic activity groupings - industry, agriculture, forestry, transp...
Bulgaria 2016
The National Statistical Institute presents the bilingual (Bulgarian/English) brochure Bulgaria 2016 to users of statistical information. The brochure is addressed to a wide range of users (international institutions, businessmen, students, experts etc.) and changes the traditional presentation of statistical information by offering an innovative structure with a parallel translation in English. The publication contains topical statistical information about the demographic, social and economic development of the country over the 2011 - 2015 period. It also includes non-traditiona...
Statistical Yearbook 2015
The National Statistical Institute (NSI) has the pleasure to present to the attention of national and foreign users of statistical information the 83rd edition of the ‘Statistical Yearbook of the Republic of Bulgaria’ in printed and electronic format.
It provides current statistical information about the demographic, economic and social development of the country for 2010 - 2014 in different territorial and classification aggregations and breakdowns.
According to the Law on Statistics, official source of information in the Republic of Bulgaria is the ...
Crimes and Persons Convicted 2014
The NSI annual electronic bilingual publication of the NSI Crimes and Persons Convicted 2014, containing data on crimes with penalty inflicted, accused persons and persons convicted is available for users of statistical information.
The issue includes data about the activity of district, regional and military courts as well as Specialized Criminal Court in penal cases of a general, private and administrative nature. Comparable data on crimes with penalty inflicted, as well as persons convicted with sentences in force for 1990 - 2014 p...
Statistical Reference Book 2015

The National Statistical Institute presents to users of statistical information the annual publication - Statistical Reference Book 2015 in English.
The Statistical Reference Book presents topical information on the demographic processes as well as the economic, social and cultural development of the Republic of Bulgaria for the 2010 - 2014 period.
The publication presents data on main macroeconomic indicators of the national economy - gross domestic product, investments and finance; and economic activity groupings - industry, agriculture, forestry, transport, c...
Statistical Reference Book 2015 (Bulgarian version)

The National Statistical Institute presents to users of statistical information the annual publication - Statistical Reference Book 2015 in Bulgarian.
The Statistical Reference Book presents topical information on the demographic processes as well as the economic, social and cultural development of the Republic of Bulgaria for the 2010 - 2014 period.
The publication presents data on main macroeconomic indicators of the national economy - gross domestic product, investments and finance; and economic activity groupings - industry, agriculture, forestry, transport,...
Bulgaria 2015
The National Statistical Institute presents the bilingual (Bulgarian/English) brochure Bulgaria 2015 to users of statistical information. The brochure is addressed to a wide range of users (international institutions, businessmen, students, experts etc.) and changes the traditional presentation of statistical information by offering an innovative structure with a parallel translation in English. The publication contains topical statistical information about the demographic, social and economic development of the country over the 2010 - 2014 period. It also includes non-tra...
Statistical Yearbook 2014
The National Statistical Institute (NSI) has the pleasure to present to the attention of national and foreign users of statistical information the 82nd edition of the ‘Statistical Yearbook of the Republic of Bulgaria’ in printed and electronic format.
It provides current statistical information about the demographic, economic and social development of the country for 2009 - 2013 in different territorial and classification aggregations and breakdowns.
According to the Law on Statistics, official source of information in the Republic of Bulgaria is the Nati...
Crimes and Persons Convicted 2013
The NSI annual electronic bilingual publication of the NSI Crimes and Persons Convicted 2013, containing data on crimes with penalty inflicted, accused persons and persons convicted, is available for users of statistical information.
The issue includes data about the activity of district, regional and military courts as well as Specialized Criminal Court in penal cases of a general, private and administrative nature. Comparable data on crimes with penalty inflicted, as well as persons convicted with sentences in force for 1989 - 2013 period are al...
Statistical Reference Book 2014
The National Statistical Institute presents to users of statistical information the annual publication - Statistical Reference Book 2014 in English.
The Statistical Reference Book presents topical information on the demographic processes as well as the economic, social and cultural development of the Republic of Bulgaria for the 2009 - 2013 period.
The publication presents data on main macroeconomic indicators of the national economy - gross domestic product, investments and finance; and economic activity groupings - industry, agriculture, forestry, tran...
Statistical Reference Book 2014 (Bulgarian version)
The National Statistical Institute presents to users of statistical information the annual publication - Statistical Reference Book 2014 in Bulgarian.
The Statistical Reference Book presents topical information on the demographic processes as well as the economic, social and cultural development of the Republic of Bulgaria for the 2009 - 2013 period.
The publication presents data on main macroeconomic indicators of the national economy - gross domestic product, investments and finance; and economic activity groupings - industry, agriculture, forestry, tr...
Bulgaria 2014

The National Statistical Institute presents the bilingual (Bulgarian/English) brochure Bulgaria 2014 to users of statistical information. The brochure is addressed to a wide range of users (international institutions, businessmen, students, experts etc.) and changes the traditional presentation of statistical information by offering an innovative structure with a parallel translation in English. The publication contains topical statistical information about the demographic, social and economic development of the country over the 2008 - 2013 period. It also includes non-traditional ...
Statistical Yearbook 2013
The National Statistical Institute (NSI) has the pleasure to present to the attention of national and foreign users of statistical information the 81st edition of the ‘Statistical Yearbook of the Republic of Bulgaria’ in printed and electronic format.
It provides current statistical information about the demographic, economic and social development of the country for 2008 - 2012 in different territorial and classification aggregations and breakdowns.
According to the Law on Statistics, official source of information in the Republic of Bulgaria is the Nati...
Crimes and Persons Convicted 2012

The NSI annual electronic bilingual publication of the NSI Crimes and Persons Convicted 2012, containing data on crimes with penalty inflicted, accused persons and persons convicted, is available for users of statistical information.
The issue includes data about the activity of district, regional and military courts as well as Specialized Criminal Court in penal cases of a general, private and administrative nature. Comparable data on crimes with penalty inflicted, as well as persons convicted with sentences in force for 1989 - 2012 perio...
Statistical Reference Book 2013
The National Statistical Institute presents to users of statistical information the annual publication - Statistical Reference Book 2013 in English.
The Statistical Reference Book presents topical information on the demographic processes as well as the economic, social and cultural development of the Republic of Bulgaria for the 2008 - 2012 period.
The publication presents data on main macroeconomic indicators of the national economy - gross domestic product, investments and finance; and economic activity groupings - industry, agric...
Statistical Reference Book 2013 (Bulgarian version)

The National Statistical Institute presents to users of statistical information the annual publication - Statistical Reference Book 2013 in Bulgarian.
The Statistical Reference Book presents topical information on the demographic processes as well as the economic, social and cultural development of the Republic of Bulgaria for the 2008 - 2012 period.
The publication presents data on main macroeconomic indicators of the national economy - gross domestic product, investments and finance; and economic activity groupings - industry, agr...
Bulgaria 2013

The National Statistical Institute presents the bilingual (Bulgarian/English) brochure Bulgaria 2013 to users of statistical information. The brochure is addressed to a wide range of users (international institutions, businessmen, students, experts etc.) and changes the traditional presentation of statistical information by offering an innovative structure with a parallel translation in English. The publication contains topical statistical information about the demographic, social and economic development of the country over the 2007 - 2012 period. It also inc...
Crimes and Persons Convicted 2011
The NSI annual electronic bilingual publication Crimes and Persons Convicted 2011, containing data on crimes with penalty inflicted is available for users of statistical information. The issue includes data about the activity of regional, district and martial courts in penal cases of a general, private and administrative nature. Comparable data on crimes with penalty inflicted, as well as persons convicted with sentences in force for 1989 - 2011 period are also shown.
The issue contains basic methodological notes and analysis of crimes with penal...
Statistical Reference Book 2012

The National Statistical Institute presents to users of statistical information the annual publication - Statistical Reference Book 2012 in English.
The Statistical Reference Book represents topical information on the demographic processes as well as the economic, social and cultural development of the Republic of Bulgaria for the 2007 - 2011 period.
The publication presents data on main macroeconomic indicators of the national economy - gross domestic product, investments and finance; and economic activity groupings - industry, agr...
Statistical Reference Book 2012 (Bulgarian version)

The National Statistical Institute presents to users of statistical information the annual publication - Statistical Reference Book 2012 in Bulgarian.
The Statistical Reference Book presents topical information on the demographic processes as well as the economic, social and cultural development of the Republic of Bulgaria for the 2007 - 2011 period.
The publication presents data on main macroeconomic indicators of the national economy - gross domestic product, investments and finance; and economic activity groupings&...
Bulgaria 2012
The National Statistical Institute presents the bilingual (Bulgarian/English) brochure Bulgaria 2012 to users of statistical information. The brochure is addressed to a wide range of users (international institutions, businessmen, students, experts etc.) and changes the traditional presentation of statistical information by offering an innovative structure with a parallel translation in English. The publication contains topical statistical information about the demographic, social and economic development of the country over the 2006 - 2011 period. It also inc...
Statistical Yearbook 2011
The National Statistical Institute (NSI) has the pleasure to submit to the attention of national and foreign users of statistical information the 79th edition of the ‘Statistical Yearbook of the Republic of Bulgaria’ in printed and electronic format.
It provides current statistical information about the demographic, economic and social development of the country for the 2005 - 2010 period in different territorial and classification aggregations and breakdowns.
According ...
Crimes and Persons Convicted 2010
The NSI annual electronic bilingual publication Crimes and Persons Convicted 2010, containing data on crimes with penalty inflicted is available for users of statistical information. The issue includes data about the activity of regional, district and martial courts in penal cases of a general, private and administrative nature. Comparable data on crimes with penalty inflicted, as well as persons convicted with sentences in force for 1989 - 2010 period are also shown.
The issue contains basic methodological notes and analysis of crimes with penalt...
Statistical Reference Book 2011
The National Statistical Institute presents to users of statistical information the annual publication - Statistical Reference Book 2011 in English. It is a concise form of the same issue in Bulgarian.
The Statistical Reference Book presents topical information on the demographic processes as well as the economic, social and cultural development of the Republic of Bulgaria for the 2006 - 2010 period.
The publication presents data on main macroeconomic indicators of the national economy - gross domestic product, investments...
Bulgaria 2011
The National Statistical Institute presents the bilingual (Bulgarian/English) brochure Bulgaria 2011 to users of statistical information. The brochure is addressed to a wide range of users (international institutions, businessmen, students, experts etc.) and changes the traditional presentation of statistical information by offering an innovative structure with a parallel translation in English. The publication contains topical statistical information about the demographic, social and economic development of the country over the 2005 - 2010 period. It als...
Statistical Yearbook 2010
The National Statistical Institute (NSI) has the pleasure to submit to the attention of national and foreign users of statistical information the 78th edition of the ‘Statistical Yearbook of the Republic of Bulgaria’ in printed and electronic format.
It provides current statistical information about the demographic, economic and social development of the country for the 2004 - 2009 period in different territorial and classification aggregations and breakdowns.
Accor...
Statistical Yearbook 2009
The National Statistical Institute (NSI) has the pleasure to submit to the attention of national and foreign users of statistical information the 77th edition of the ‘Statistical Yearbook of the Republic of Bulgaria’ in printed and electronic format. The issue is published in 2010, which marks 130 years since the establishment of a statistical institution in Bulgaria and 100 years since publishing of the first ‘Statistical Yearbook of the Bulgarian Kingdom’ in 1910.
This issue has new design and layout. It provides current statistical information about ...
Crimes and Persons Convicted 2009
The NSI annual electronic bilingual publication Crimes and Persons Convicted 2009, containing data on crimes with penalty inflicted is available for users of statistical information. The issue includes data about the activity of regional, district and martial courts in penal cases of a general, private and administrative nature. Comparable data on crimes with penalty inflicted, as well as persons convicted with sentences in force for 1989 - 2009 period are also shown.
The issue contains basic methodological notes and analysis of crimes with penalt...
Statistical Reference Book 2010
The National Statistical Institute presents to users of statistical information the annual publication - Statistical Reference Book 2010 in English. It is a concise form of the same issue in Bulgarian.
The Statistical Reference Book presents topical information on the demographic processes as well as the economic, social and cultural development of the Republic of Bulgaria for the 2005 - 2009 period.
The publication presents data on main macroeconomic indicators of the national economy - gross domestic product, investments...
Bulgaria 2010
The National Statistical Institute presents the bilingual (Bulgarian/English) brochure Bulgaria 2010 to users of statistical information. The brochure is addressed to a wide range of users (international institutions, businessmen, students, experts etc.) and changes the traditional presentation of statistical information by offering an innovative structure with a parallel translation in English. The publication contains topical statistical information about the demographic, social and economic development of the country over the 2003 - 2009 period. It also inc...
Statistical Reference Book 2009
The National Statistical Institute presents to users of statistical information the annual publication - Statistical Reference Book 2009 in English. It is a concise form of the same issue in Bulgarian.
The issue is with a new design and enrich contents. For the first time are included methodological and analytic notes towards all chapters. The information is illustrated with a rich graphic materials.
The Statistical Reference Book presents topical information on the demographic processes as well as the economic, social and cultural ...
Crimes and Persons Convicted 2008
The National Statistical Institute presents to users of statistical information annual electronic bilingual publication Crimes and Persons Convicted 2008, containing data on crimes with penalty inflicted. The issue includes data about the activity of regional, district and martial courts in penal cases of a general, private and administrative nature. Comparable data on crimes with penalty inflicted, as well as persons convicted with sentences in force for 1989 - 2008 period are also shown.
The issue contains basic methodological notes and analysis...
Bulgaria 2009
The National Statistical Institute presents the bilingual (Bulgarian/English) brochure Bulgaria 2009 to users of statistical information. The brochure is addressed to a wide range of users (international institutions, businessmen, students, experts etc.) and changes the traditional presentation of statistical information by offering an innovative structure with a parallel translation in English. The publication contains topical statistical information about the demographic, social and economic development of the country over the 2003 - 2008 period. It also inc...
Statistical Yearbook 2008
The National Statistical Institute has the pleasure to submit to the attention of national and foreign users of statistical information the 76th edition of the Statistical Yearbook of the Republic of Bulgaria 2008. It provides topical statistical information on the demographic, economic and social development of the country for the 2002 - 2007 period in different territorial and classification aggregations and breakdowns.
According to the Law on Statistics, official source of information in the Republic of Bulgaria is the National Statistical System, wh...
Statistical Reference Book of the Republic of Bulgaria 2008
The National Statistical Institute presents to users of statistical information one of its main publications - Statistical Reference Book of the Republic of Bulgaria 2008 in English. It is a concise form of the same issue in Bulgarian.
The Statistical Reference Book presents topical information on the demographic processes as well as the economic, social and cultural development of the Republic of Bulgaria for the 2004 - 2007 period.
The publication presents data on main macroeconomic indicators of the national economy - gross dom...


