Participants in formal or non-formal education and training
| Total - Number | Participated | Not participated | |||
|---|---|---|---|---|---|
| Number | % | Number | % | ||
| Total | 3 381 922 | 697 667 | 20.6% | 2 684 255 | 79.4% |
| By sex | |||||
| Males | 1 698 457 | 328 098 | 19.3% | 1 370 359 | 80.7% |
| Females | 1 683 465 | 369 569 | 22.0% | 1 313 896 | 78.0% |
| By age | |||||
| 25 - 34 | 662 421 | 179 713 | 27.1% | 482 708 | 72.9% |
| 35 - 54 | 888 571 | 180 886 | 20.4% | 707 685 | 79.6% |
| 45 - 54 | 995 403 | 215 783 | 21.7% | 779 620 | 78.3% |
| 55 - 64 | 835 527 | 121 285 | 14.5% | 714 242 | 85.5% |
| By educational attainment | |||||
| Basic education and below | 508 414 | 28 221 | 5.6% | 480 193 | 94.4% |
| Secondary education | 1 858 722 | 322 400 | 17.3% | 1 536 323 | 82.7% |
| Tertiary education | 1 014 785 | 347 046 | 34.2% | 667 739 | 65.8% |
| By labour status1 | |||||
| Employed | 2 352 009 | 657 778 | 28.0% | 1 694 231 | 72.0% |
| Unemployed | 543 735 | 11 780 | 2.2% | 531 955 | 97.8% |
| Inactive | 486 178 | 28 109 | 5.8% | 458 069 | 94.2% |
| By residence | |||||
| Urban | 2 510 155 | 594 111 | 23.7% | 1 916 044 | 76.3% |
| Rural | 871 767 | 103 556 | 11.9% | 768 212 | 88.1% |
1 According to the survey methodology, distribution by labour status is based on interviewees opinion (self-assesment), not by International Labour Organisation (ILO) definitions. |
|||||
14.09.2023
Euro-SDMX Metadata Structure (ESMS)
| Contact | |||||||||||||||||||||||||||||||||||||||||||||||||||||||||||||||||||||||||||||||||||||||||||||||||||||||||||||||||||||||||||||||||||||||||||||||||||||||||||||
|---|---|---|---|---|---|---|---|---|---|---|---|---|---|---|---|---|---|---|---|---|---|---|---|---|---|---|---|---|---|---|---|---|---|---|---|---|---|---|---|---|---|---|---|---|---|---|---|---|---|---|---|---|---|---|---|---|---|---|---|---|---|---|---|---|---|---|---|---|---|---|---|---|---|---|---|---|---|---|---|---|---|---|---|---|---|---|---|---|---|---|---|---|---|---|---|---|---|---|---|---|---|---|---|---|---|---|---|---|---|---|---|---|---|---|---|---|---|---|---|---|---|---|---|---|---|---|---|---|---|---|---|---|---|---|---|---|---|---|---|---|---|---|---|---|---|---|---|---|---|---|---|---|---|---|---|---|---|
| Contact organisation | National Statistical Institute of Bulgaria | ||||||||||||||||||||||||||||||||||||||||||||||||||||||||||||||||||||||||||||||||||||||||||||||||||||||||||||||||||||||||||||||||||||||||||||||||||||||||||||
| Contact organisation unit | Education and Culture Statistics Department | ||||||||||||||||||||||||||||||||||||||||||||||||||||||||||||||||||||||||||||||||||||||||||||||||||||||||||||||||||||||||||||||||||||||||||||||||||||||||||||
| Contact name | Elena Tsankova | ||||||||||||||||||||||||||||||||||||||||||||||||||||||||||||||||||||||||||||||||||||||||||||||||||||||||||||||||||||||||||||||||||||||||||||||||||||||||||||
| Contact person function | State expert | ||||||||||||||||||||||||||||||||||||||||||||||||||||||||||||||||||||||||||||||||||||||||||||||||||||||||||||||||||||||||||||||||||||||||||||||||||||||||||||
| Contact mail address | 2, P. Volov Str.; 1038 Sofia, Bulgaria | ||||||||||||||||||||||||||||||||||||||||||||||||||||||||||||||||||||||||||||||||||||||||||||||||||||||||||||||||||||||||||||||||||||||||||||||||||||||||||||
| Contact email address | |||||||||||||||||||||||||||||||||||||||||||||||||||||||||||||||||||||||||||||||||||||||||||||||||||||||||||||||||||||||||||||||||||||||||||||||||||||||||||||
| Contact phone number | +359 2 9857 511 | ||||||||||||||||||||||||||||||||||||||||||||||||||||||||||||||||||||||||||||||||||||||||||||||||||||||||||||||||||||||||||||||||||||||||||||||||||||||||||||
| Contact fax number | |||||||||||||||||||||||||||||||||||||||||||||||||||||||||||||||||||||||||||||||||||||||||||||||||||||||||||||||||||||||||||||||||||||||||||||||||||||||||||||
| Metadata update | |||||||||||||||||||||||||||||||||||||||||||||||||||||||||||||||||||||||||||||||||||||||||||||||||||||||||||||||||||||||||||||||||||||||||||||||||||||||||||||
| Metadata last certified | 25 January 2024 | ||||||||||||||||||||||||||||||||||||||||||||||||||||||||||||||||||||||||||||||||||||||||||||||||||||||||||||||||||||||||||||||||||||||||||||||||||||||||||||
| Metadata last posted | 25 January 2024 | ||||||||||||||||||||||||||||||||||||||||||||||||||||||||||||||||||||||||||||||||||||||||||||||||||||||||||||||||||||||||||||||||||||||||||||||||||||||||||||
| Metadata last update | 25 January 2024 | ||||||||||||||||||||||||||||||||||||||||||||||||||||||||||||||||||||||||||||||||||||||||||||||||||||||||||||||||||||||||||||||||||||||||||||||||||||||||||||
| Statistical presentation | |||||||||||||||||||||||||||||||||||||||||||||||||||||||||||||||||||||||||||||||||||||||||||||||||||||||||||||||||||||||||||||||||||||||||||||||||||||||||||||
| Data description | The Adult Education Survey (AES) covers adults’ participation in education and training (formal - FED, non-formal - NFE and informal learning - INF). The reference period for the participation in education and training is the twelve months prior to the interview. The survey was conducted in all EU member states according to a common methodology which ensures international comparability of the data. Information available from the AES is grouped around the following topics:
The AES focuses on people aged:
For further information see the 2022 AES legislation (http://ec.europa.eu/eurostat/web/education-and-training/legislation) and the 2022 AES implementation manual (http://ec.europa.eu/eurostat/web/education-and-training/methodology).
Additional module to the Adult Education Survey: Cultural participation Participation in cultural events refers to going to the cinema, live performances, visiting cultural sites, wherever these events take place and whether these activities are performed by professionals or amateurs. Individuals are also observed by the number of books and newspapers read. Data from the module are published on the NSI’s website, Culture section. | ||||||||||||||||||||||||||||||||||||||||||||||||||||||||||||||||||||||||||||||||||||||||||||||||||||||||||||||||||||||||||||||||||||||||||||||||||||||||||||
| Classification system |
| ||||||||||||||||||||||||||||||||||||||||||||||||||||||||||||||||||||||||||||||||||||||||||||||||||||||||||||||||||||||||||||||||||||||||||||||||||||||||||||
| Sector coverage | The survey is conducted on the whole territory of Bulgaria, with data collected for a period of twelve months prior to the interview. | ||||||||||||||||||||||||||||||||||||||||||||||||||||||||||||||||||||||||||||||||||||||||||||||||||||||||||||||||||||||||||||||||||||||||||||||||||||||||||||
| Statistical concepts and definitions | Definitions as well as the list of variables covered are available in the 2022 AES implementation manual (http://ec.europa.eu/eurostat/web/education-and-training/methodology).
Additional module to the Adult Education Survey:
| ||||||||||||||||||||||||||||||||||||||||||||||||||||||||||||||||||||||||||||||||||||||||||||||||||||||||||||||||||||||||||||||||||||||||||||||||||||||||||||
| Statistical unit | Individuals, learning activities. | ||||||||||||||||||||||||||||||||||||||||||||||||||||||||||||||||||||||||||||||||||||||||||||||||||||||||||||||||||||||||||||||||||||||||||||||||||||||||||||
| Statistical population | Individuals living in private households: AES 2007 – aged 25-64 AES 2011 – aged 18-64 AES 2016 and AES 2022 – aged 18-69 | ||||||||||||||||||||||||||||||||||||||||||||||||||||||||||||||||||||||||||||||||||||||||||||||||||||||||||||||||||||||||||||||||||||||||||||||||||||||||||||
| Reference area | The whole territory of the country. | ||||||||||||||||||||||||||||||||||||||||||||||||||||||||||||||||||||||||||||||||||||||||||||||||||||||||||||||||||||||||||||||||||||||||||||||||||||||||||||
| Time coverage | AES 2007 - fieldwork period: 01.11.2007 - 30.12.2007 AES 2011 - fieldwork period: 16.11.2011 - 15.01.2012 AES 2016 - fieldwork period: 15.11.2016 - 20.01.2017 AES 2022 - fieldwork period: 12.12.2022 - 17.03.2023 | ||||||||||||||||||||||||||||||||||||||||||||||||||||||||||||||||||||||||||||||||||||||||||||||||||||||||||||||||||||||||||||||||||||||||||||||||||||||||||||
| Base period | Not applicable. | ||||||||||||||||||||||||||||||||||||||||||||||||||||||||||||||||||||||||||||||||||||||||||||||||||||||||||||||||||||||||||||||||||||||||||||||||||||||||||||
| Unit of measure | |||||||||||||||||||||||||||||||||||||||||||||||||||||||||||||||||||||||||||||||||||||||||||||||||||||||||||||||||||||||||||||||||||||||||||||||||||||||||||||
Number, BGN/EUR. | |||||||||||||||||||||||||||||||||||||||||||||||||||||||||||||||||||||||||||||||||||||||||||||||||||||||||||||||||||||||||||||||||||||||||||||||||||||||||||||
| Reference period | |||||||||||||||||||||||||||||||||||||||||||||||||||||||||||||||||||||||||||||||||||||||||||||||||||||||||||||||||||||||||||||||||||||||||||||||||||||||||||||
The reference period for the participation in education and training is the twelve months prior to the interview. Fieldwork periods: AES 2007 - 01.11.2007 - 30.12.2007 AES 2011 - 16.11.2011 - 15.01.2012 AES 2016 - 15.11.2016 - 20.01.2017 AES 2022 - 12.12.2022 - 17.03.2023 | |||||||||||||||||||||||||||||||||||||||||||||||||||||||||||||||||||||||||||||||||||||||||||||||||||||||||||||||||||||||||||||||||||||||||||||||||||||||||||||
| Institutional mandate | |||||||||||||||||||||||||||||||||||||||||||||||||||||||||||||||||||||||||||||||||||||||||||||||||||||||||||||||||||||||||||||||||||||||||||||||||||||||||||||
| Legal acts and other agreements |
| ||||||||||||||||||||||||||||||||||||||||||||||||||||||||||||||||||||||||||||||||||||||||||||||||||||||||||||||||||||||||||||||||||||||||||||||||||||||||||||
| Data sharing | Not applicable. | ||||||||||||||||||||||||||||||||||||||||||||||||||||||||||||||||||||||||||||||||||||||||||||||||||||||||||||||||||||||||||||||||||||||||||||||||||||||||||||
| Confidentiality | |||||||||||||||||||||||||||||||||||||||||||||||||||||||||||||||||||||||||||||||||||||||||||||||||||||||||||||||||||||||||||||||||||||||||||||||||||||||||||||
| Confidentiality - policy | According to the Law on Statistics (Articles 25 and 26). | ||||||||||||||||||||||||||||||||||||||||||||||||||||||||||||||||||||||||||||||||||||||||||||||||||||||||||||||||||||||||||||||||||||||||||||||||||||||||||||
| Confidentiality - data treatment | According to the Law on Statistics (Articles 25 and 26). | ||||||||||||||||||||||||||||||||||||||||||||||||||||||||||||||||||||||||||||||||||||||||||||||||||||||||||||||||||||||||||||||||||||||||||||||||||||||||||||
| Release policy | |||||||||||||||||||||||||||||||||||||||||||||||||||||||||||||||||||||||||||||||||||||||||||||||||||||||||||||||||||||||||||||||||||||||||||||||||||||||||||||
| Release calendar | Release Calendar presenting the results of the statistical surveys carried out by the National Statistical Institute is published on the NSI’s website. | ||||||||||||||||||||||||||||||||||||||||||||||||||||||||||||||||||||||||||||||||||||||||||||||||||||||||||||||||||||||||||||||||||||||||||||||||||||||||||||
| Release calendar access | |||||||||||||||||||||||||||||||||||||||||||||||||||||||||||||||||||||||||||||||||||||||||||||||||||||||||||||||||||||||||||||||||||||||||||||||||||||||||||||
| User access | In accordance to the Rules for Dissemination of Statistical Products and Services - https://www.nsi.bg/en/node/564/. | ||||||||||||||||||||||||||||||||||||||||||||||||||||||||||||||||||||||||||||||||||||||||||||||||||||||||||||||||||||||||||||||||||||||||||||||||||||||||||||
| Frequency of dissemination | |||||||||||||||||||||||||||||||||||||||||||||||||||||||||||||||||||||||||||||||||||||||||||||||||||||||||||||||||||||||||||||||||||||||||||||||||||||||||||||
Every 6 years. | |||||||||||||||||||||||||||||||||||||||||||||||||||||||||||||||||||||||||||||||||||||||||||||||||||||||||||||||||||||||||||||||||||||||||||||||||||||||||||||
| Accessibility and clarity | |||||||||||||||||||||||||||||||||||||||||||||||||||||||||||||||||||||||||||||||||||||||||||||||||||||||||||||||||||||||||||||||||||||||||||||||||||||||||||||
| News release | Press releases were published at the NSI’s website: AES 2016: www.nsi.bg/en/node/15477/ AES 2022: www.nsi.bg/en/node/20763/ | ||||||||||||||||||||||||||||||||||||||||||||||||||||||||||||||||||||||||||||||||||||||||||||||||||||||||||||||||||||||||||||||||||||||||||||||||||||||||||||
| Publications | AES 2007: https://nsi.bg/en/node/3385/ | ||||||||||||||||||||||||||||||||||||||||||||||||||||||||||||||||||||||||||||||||||||||||||||||||||||||||||||||||||||||||||||||||||||||||||||||||||||||||||||
| On-line database | Information System INFOSTAT of the National Statistical Institute: | ||||||||||||||||||||||||||||||||||||||||||||||||||||||||||||||||||||||||||||||||||||||||||||||||||||||||||||||||||||||||||||||||||||||||||||||||||||||||||||
| Micro-data access | In accordance with the internal (for the NSI) Rules for Provision of Anonymised Individual Data for Scientific and Research Purposes (https://www.nsi.bg/en/node/12152/). | ||||||||||||||||||||||||||||||||||||||||||||||||||||||||||||||||||||||||||||||||||||||||||||||||||||||||||||||||||||||||||||||||||||||||||||||||||||||||||||
| Other | Not available. | ||||||||||||||||||||||||||||||||||||||||||||||||||||||||||||||||||||||||||||||||||||||||||||||||||||||||||||||||||||||||||||||||||||||||||||||||||||||||||||
| Documentation on methodology | Metadata and methodological notes were published on the NSI’s website: https://www.nsi.bg/en/node/4936/ and the 2022 AES implementation manual (http://ec.europa.eu/eurostat/web/education-and-training/methodology). | ||||||||||||||||||||||||||||||||||||||||||||||||||||||||||||||||||||||||||||||||||||||||||||||||||||||||||||||||||||||||||||||||||||||||||||||||||||||||||||
| Quality documentation | The national quality report was published at the NSI’s website: https://www.nsi.bg/en/node/15103/ | ||||||||||||||||||||||||||||||||||||||||||||||||||||||||||||||||||||||||||||||||||||||||||||||||||||||||||||||||||||||||||||||||||||||||||||||||||||||||||||
| Quality management | |||||||||||||||||||||||||||||||||||||||||||||||||||||||||||||||||||||||||||||||||||||||||||||||||||||||||||||||||||||||||||||||||||||||||||||||||||||||||||||
| Quality assurance | A set of quality criteria have been set up according to the regulations. | ||||||||||||||||||||||||||||||||||||||||||||||||||||||||||||||||||||||||||||||||||||||||||||||||||||||||||||||||||||||||||||||||||||||||||||||||||||||||||||
| Quality assessment | The quality report presents basic information on the quality at national level. | ||||||||||||||||||||||||||||||||||||||||||||||||||||||||||||||||||||||||||||||||||||||||||||||||||||||||||||||||||||||||||||||||||||||||||||||||||||||||||||
| Relevance | |||||||||||||||||||||||||||||||||||||||||||||||||||||||||||||||||||||||||||||||||||||||||||||||||||||||||||||||||||||||||||||||||||||||||||||||||||||||||||||
| User needs | Main users: European Commission (DGs, Secretariat General), Council; Ministry of Education and Science, Ministry of Labour and Social Policy, National Agency for Vocational Education and Training; OECD, UN, CEDEFOP. | ||||||||||||||||||||||||||||||||||||||||||||||||||||||||||||||||||||||||||||||||||||||||||||||||||||||||||||||||||||||||||||||||||||||||||||||||||||||||||||
| User satisfaction | Not available. | ||||||||||||||||||||||||||||||||||||||||||||||||||||||||||||||||||||||||||||||||||||||||||||||||||||||||||||||||||||||||||||||||||||||||||||||||||||||||||||
| Completeness | Not available. | ||||||||||||||||||||||||||||||||||||||||||||||||||||||||||||||||||||||||||||||||||||||||||||||||||||||||||||||||||||||||||||||||||||||||||||||||||||||||||||
| Accuracy and reliability | |||||||||||||||||||||||||||||||||||||||||||||||||||||||||||||||||||||||||||||||||||||||||||||||||||||||||||||||||||||||||||||||||||||||||||||||||||||||||||||
| Overall accuracy | The overall accuracy is considered as good. | ||||||||||||||||||||||||||||||||||||||||||||||||||||||||||||||||||||||||||||||||||||||||||||||||||||||||||||||||||||||||||||||||||||||||||||||||||||||||||||
| Sampling error | Sampling errors for 2022 AES key statistics are presented in the quality report. | ||||||||||||||||||||||||||||||||||||||||||||||||||||||||||||||||||||||||||||||||||||||||||||||||||||||||||||||||||||||||||||||||||||||||||||||||||||||||||||
| Non-sampling error | Response rate: AES 2007 - 81.5% AES 2011 - 87.9% AES 2016 - 77.2% AES 2022 - 73.3% | ||||||||||||||||||||||||||||||||||||||||||||||||||||||||||||||||||||||||||||||||||||||||||||||||||||||||||||||||||||||||||||||||||||||||||||||||||||||||||||
| Timeliness and punctuality | |||||||||||||||||||||||||||||||||||||||||||||||||||||||||||||||||||||||||||||||||||||||||||||||||||||||||||||||||||||||||||||||||||||||||||||||||||||||||||||
| Timeliness | The reference period for 2022 AES is the 12 months prior to the interview, with exception for the background variables and language module (the moment of interview). | ||||||||||||||||||||||||||||||||||||||||||||||||||||||||||||||||||||||||||||||||||||||||||||||||||||||||||||||||||||||||||||||||||||||||||||||||||||||||||||
| Punctuality | Project phases - dates
| ||||||||||||||||||||||||||||||||||||||||||||||||||||||||||||||||||||||||||||||||||||||||||||||||||||||||||||||||||||||||||||||||||||||||||||||||||||||||||||
| Coherence and comparability | |||||||||||||||||||||||||||||||||||||||||||||||||||||||||||||||||||||||||||||||||||||||||||||||||||||||||||||||||||||||||||||||||||||||||||||||||||||||||||||
| Comparability - geographical | Full comparability with all EU member states. | ||||||||||||||||||||||||||||||||||||||||||||||||||||||||||||||||||||||||||||||||||||||||||||||||||||||||||||||||||||||||||||||||||||||||||||||||||||||||||||
| Comparability - over time | Partial comparability between the different waves of the survey due to differences in the overall methodology. 2011 AES collected INF differently and is therefore not comparable with the other waves. | ||||||||||||||||||||||||||||||||||||||||||||||||||||||||||||||||||||||||||||||||||||||||||||||||||||||||||||||||||||||||||||||||||||||||||||||||||||||||||||
| Coherence - cross domain |
| ||||||||||||||||||||||||||||||||||||||||||||||||||||||||||||||||||||||||||||||||||||||||||||||||||||||||||||||||||||||||||||||||||||||||||||||||||||||||||||
| Coherence - internal | AES results for a given data collection round are based on the same microdata and results are calculated using the same estimation methods, therefore the data are internally coherent. | ||||||||||||||||||||||||||||||||||||||||||||||||||||||||||||||||||||||||||||||||||||||||||||||||||||||||||||||||||||||||||||||||||||||||||||||||||||||||||||
| Cost and burden | |||||||||||||||||||||||||||||||||||||||||||||||||||||||||||||||||||||||||||||||||||||||||||||||||||||||||||||||||||||||||||||||||||||||||||||||||||||||||||||
Staff involved in conducting the survey (AES 2022): 5 experts from the NSI's Education and Culture Statistics Department - responsible for survey organization, implementation of methodology, preparation of the national questionnaire and interviewers manual, sampling, training of regional coordinators, data processing, preparation of EU dataset and quality report, data dissemination; 3 experts from the NSI's Information Systems and Application Software Department - responsible for preparation of the interviewing application; 28 regional coordinators from the Regional Statistical Offices - responsible for organization of the fieldwork, training of the interviewers and supervision of the fieldwork. | |||||||||||||||||||||||||||||||||||||||||||||||||||||||||||||||||||||||||||||||||||||||||||||||||||||||||||||||||||||||||||||||||||||||||||||||||||||||||||||
| Data revision | |||||||||||||||||||||||||||||||||||||||||||||||||||||||||||||||||||||||||||||||||||||||||||||||||||||||||||||||||||||||||||||||||||||||||||||||||||||||||||||
| Data revision - policy | Not applicable. | ||||||||||||||||||||||||||||||||||||||||||||||||||||||||||||||||||||||||||||||||||||||||||||||||||||||||||||||||||||||||||||||||||||||||||||||||||||||||||||
| Data revision - practice | Not applicable. | ||||||||||||||||||||||||||||||||||||||||||||||||||||||||||||||||||||||||||||||||||||||||||||||||||||||||||||||||||||||||||||||||||||||||||||||||||||||||||||
| Statistical processing | |||||||||||||||||||||||||||||||||||||||||||||||||||||||||||||||||||||||||||||||||||||||||||||||||||||||||||||||||||||||||||||||||||||||||||||||||||||||||||||
| Source data | BG: Изследване на образованието и обучението на възрастни EN: Adult Education Survey (AES). Participation in the survey was voluntary. | ||||||||||||||||||||||||||||||||||||||||||||||||||||||||||||||||||||||||||||||||||||||||||||||||||||||||||||||||||||||||||||||||||||||||||||||||||||||||||||
| Frequency of data collection | Every 6 years. | ||||||||||||||||||||||||||||||||||||||||||||||||||||||||||||||||||||||||||||||||||||||||||||||||||||||||||||||||||||||||||||||||||||||||||||||||||||||||||||
| Data collection | AES was a stand-alone survey. Survey type was Face-to-face. Proxy answers are not allowed at all. AES 2007, 2011, 2016 - Paper And Pencil Interview (PAPI). AES 2022 - Computer Assisted Interview (CAPI). Simple random sampling of two NFE activities was performed by the electronic application during the interview. | ||||||||||||||||||||||||||||||||||||||||||||||||||||||||||||||||||||||||||||||||||||||||||||||||||||||||||||||||||||||||||||||||||||||||||||||||||||||||||||
| Data validation | Validation was performed by the National Statistical Institute. Eurostat performed additional tests for quality assurance. | ||||||||||||||||||||||||||||||||||||||||||||||||||||||||||||||||||||||||||||||||||||||||||||||||||||||||||||||||||||||||||||||||||||||||||||||||||||||||||||
| Data compilation | Not applicable. | ||||||||||||||||||||||||||||||||||||||||||||||||||||||||||||||||||||||||||||||||||||||||||||||||||||||||||||||||||||||||||||||||||||||||||||||||||||||||||||
| Adjustment | Not applicable. | ||||||||||||||||||||||||||||||||||||||||||||||||||||||||||||||||||||||||||||||||||||||||||||||||||||||||||||||||||||||||||||||||||||||||||||||||||||||||||||
| Comment | |||||||||||||||||||||||||||||||||||||||||||||||||||||||||||||||||||||||||||||||||||||||||||||||||||||||||||||||||||||||||||||||||||||||||||||||||||||||||||||
Download in SDMX 2.1 file format: Adult Education Survey
Metadata Structure Definition in SDMX 2.1: ESMS_MSD+BNSI+2.0+SDMX.2.1.xml
Download in SDMX 2.0 file format: Adult Education Survey
Metadata Structure Definition in SDMX 2.0: ESMS_MSD+BNSI+2.0+SDMX.2.0.xml
ESS Standard for Quality Reports Structure (ESQRS)
| Contact | |||||||||||||||||||||||||||||||||||||||||||||||||||||||||||||||||||||||||||||||||||||||||||||||||||||||||||||||||||||||||||||||||||||||||||||||||||||||||||||
|---|---|---|---|---|---|---|---|---|---|---|---|---|---|---|---|---|---|---|---|---|---|---|---|---|---|---|---|---|---|---|---|---|---|---|---|---|---|---|---|---|---|---|---|---|---|---|---|---|---|---|---|---|---|---|---|---|---|---|---|---|---|---|---|---|---|---|---|---|---|---|---|---|---|---|---|---|---|---|---|---|---|---|---|---|---|---|---|---|---|---|---|---|---|---|---|---|---|---|---|---|---|---|---|---|---|---|---|---|---|---|---|---|---|---|---|---|---|---|---|---|---|---|---|---|---|---|---|---|---|---|---|---|---|---|---|---|---|---|---|---|---|---|---|---|---|---|---|---|---|---|---|---|---|---|---|---|---|
| Contact organisation | National Statistical Institute of Bulgaria | ||||||||||||||||||||||||||||||||||||||||||||||||||||||||||||||||||||||||||||||||||||||||||||||||||||||||||||||||||||||||||||||||||||||||||||||||||||||||||||
| Contact organisation unit | Education and Culture Statistics Department | ||||||||||||||||||||||||||||||||||||||||||||||||||||||||||||||||||||||||||||||||||||||||||||||||||||||||||||||||||||||||||||||||||||||||||||||||||||||||||||
| Contact name | Elena Tsankova | ||||||||||||||||||||||||||||||||||||||||||||||||||||||||||||||||||||||||||||||||||||||||||||||||||||||||||||||||||||||||||||||||||||||||||||||||||||||||||||
| Contact person function | State expert | ||||||||||||||||||||||||||||||||||||||||||||||||||||||||||||||||||||||||||||||||||||||||||||||||||||||||||||||||||||||||||||||||||||||||||||||||||||||||||||
| Contact mail address | 2, P. Volov Str.; 1038 Sofia, Bulgaria | ||||||||||||||||||||||||||||||||||||||||||||||||||||||||||||||||||||||||||||||||||||||||||||||||||||||||||||||||||||||||||||||||||||||||||||||||||||||||||||
| Contact email address | |||||||||||||||||||||||||||||||||||||||||||||||||||||||||||||||||||||||||||||||||||||||||||||||||||||||||||||||||||||||||||||||||||||||||||||||||||||||||||||
| Contact phone number | +359 2 9857 511 | ||||||||||||||||||||||||||||||||||||||||||||||||||||||||||||||||||||||||||||||||||||||||||||||||||||||||||||||||||||||||||||||||||||||||||||||||||||||||||||
| Contact fax number | |||||||||||||||||||||||||||||||||||||||||||||||||||||||||||||||||||||||||||||||||||||||||||||||||||||||||||||||||||||||||||||||||||||||||||||||||||||||||||||
| Statistical presentation | |||||||||||||||||||||||||||||||||||||||||||||||||||||||||||||||||||||||||||||||||||||||||||||||||||||||||||||||||||||||||||||||||||||||||||||||||||||||||||||
| Data description | The Adult Education Survey (AES) covers adults’ participation in education and training (formal - FED, non-formal - NFE and informal learning - INF). The reference period for the participation in education and training is the twelve months prior to the interview. The survey was conducted in all EU member states according to a common methodology which ensures international comparability of the data. Information available from the AES is grouped around the following topics:
The AES focuses on people aged:
For further information see the 2022 AES legislation (http://ec.europa.eu/eurostat/web/education-and-training/legislation) and the 2022 AES implementation manual (http://ec.europa.eu/eurostat/web/education-and-training/methodology).
Additional module to the Adult Education Survey: Cultural participation Participation in cultural events refers to going to the cinema, live performances, visiting cultural sites, wherever these events take place and whether these activities are performed by professionals or amateurs. Individuals are also observed by the number of books and newspapers read. Data from the module are published on the NSI’s website, Culture section. | ||||||||||||||||||||||||||||||||||||||||||||||||||||||||||||||||||||||||||||||||||||||||||||||||||||||||||||||||||||||||||||||||||||||||||||||||||||||||||||
| Classification system |
| ||||||||||||||||||||||||||||||||||||||||||||||||||||||||||||||||||||||||||||||||||||||||||||||||||||||||||||||||||||||||||||||||||||||||||||||||||||||||||||
| Sector coverage | The survey is conducted on the whole territory of Bulgaria, with data collected for a period of twelve months prior to the interview. | ||||||||||||||||||||||||||||||||||||||||||||||||||||||||||||||||||||||||||||||||||||||||||||||||||||||||||||||||||||||||||||||||||||||||||||||||||||||||||||
| Statistical concepts and definitions | Definitions as well as the list of variables covered are available in the 2022 AES implementation manual (http://ec.europa.eu/eurostat/web/education-and-training/methodology).
Additional module to the Adult Education Survey:
| ||||||||||||||||||||||||||||||||||||||||||||||||||||||||||||||||||||||||||||||||||||||||||||||||||||||||||||||||||||||||||||||||||||||||||||||||||||||||||||
| Statistical unit | Individuals, learning activities. | ||||||||||||||||||||||||||||||||||||||||||||||||||||||||||||||||||||||||||||||||||||||||||||||||||||||||||||||||||||||||||||||||||||||||||||||||||||||||||||
| Statistical population | Individuals living in private households: AES 2007 – aged 25-64 AES 2011 – aged 18-64 AES 2016 and AES 2022 – aged 18-69 | ||||||||||||||||||||||||||||||||||||||||||||||||||||||||||||||||||||||||||||||||||||||||||||||||||||||||||||||||||||||||||||||||||||||||||||||||||||||||||||
| Reference area | The whole territory of the country. | ||||||||||||||||||||||||||||||||||||||||||||||||||||||||||||||||||||||||||||||||||||||||||||||||||||||||||||||||||||||||||||||||||||||||||||||||||||||||||||
| Time coverage | AES 2007 - fieldwork period: 01.11.2007 - 30.12.2007 AES 2011 - fieldwork period: 16.11.2011 - 15.01.2012 AES 2016 - fieldwork period: 15.11.2016 - 20.01.2017 AES 2022 - fieldwork period: 12.12.2022 - 17.03.2023 | ||||||||||||||||||||||||||||||||||||||||||||||||||||||||||||||||||||||||||||||||||||||||||||||||||||||||||||||||||||||||||||||||||||||||||||||||||||||||||||
| Base period | Not applicable. | ||||||||||||||||||||||||||||||||||||||||||||||||||||||||||||||||||||||||||||||||||||||||||||||||||||||||||||||||||||||||||||||||||||||||||||||||||||||||||||
| Statistical processing | |||||||||||||||||||||||||||||||||||||||||||||||||||||||||||||||||||||||||||||||||||||||||||||||||||||||||||||||||||||||||||||||||||||||||||||||||||||||||||||
| Source data | BG: Изследване на образованието и обучението на възрастни EN: Adult Education Survey (AES). Participation in the survey was voluntary. | ||||||||||||||||||||||||||||||||||||||||||||||||||||||||||||||||||||||||||||||||||||||||||||||||||||||||||||||||||||||||||||||||||||||||||||||||||||||||||||
| Frequency of data collection | Every 6 years. | ||||||||||||||||||||||||||||||||||||||||||||||||||||||||||||||||||||||||||||||||||||||||||||||||||||||||||||||||||||||||||||||||||||||||||||||||||||||||||||
| Data collection | AES was a stand-alone survey. Survey type was Face-to-face. Proxy answers are not allowed at all. AES 2007, 2011, 2016 - Paper And Pencil Interview (PAPI). AES 2022 - Computer Assisted Interview (CAPI). Simple random sampling of two NFE activities was performed by the electronic application during the interview. | ||||||||||||||||||||||||||||||||||||||||||||||||||||||||||||||||||||||||||||||||||||||||||||||||||||||||||||||||||||||||||||||||||||||||||||||||||||||||||||
| Data validation | Validation was performed by the National Statistical Institute. Eurostat performed additional tests for quality assurance. | ||||||||||||||||||||||||||||||||||||||||||||||||||||||||||||||||||||||||||||||||||||||||||||||||||||||||||||||||||||||||||||||||||||||||||||||||||||||||||||
| Data compilation | Not applicable. | ||||||||||||||||||||||||||||||||||||||||||||||||||||||||||||||||||||||||||||||||||||||||||||||||||||||||||||||||||||||||||||||||||||||||||||||||||||||||||||
| Adjustment | Not applicable. | ||||||||||||||||||||||||||||||||||||||||||||||||||||||||||||||||||||||||||||||||||||||||||||||||||||||||||||||||||||||||||||||||||||||||||||||||||||||||||||
| Quality management | |||||||||||||||||||||||||||||||||||||||||||||||||||||||||||||||||||||||||||||||||||||||||||||||||||||||||||||||||||||||||||||||||||||||||||||||||||||||||||||
| Quality assurance | A set of quality criteria have been set up according to the regulations. | ||||||||||||||||||||||||||||||||||||||||||||||||||||||||||||||||||||||||||||||||||||||||||||||||||||||||||||||||||||||||||||||||||||||||||||||||||||||||||||
| Quality assessment | The quality report presents basic information on the quality at national level. | ||||||||||||||||||||||||||||||||||||||||||||||||||||||||||||||||||||||||||||||||||||||||||||||||||||||||||||||||||||||||||||||||||||||||||||||||||||||||||||
| Relevance | |||||||||||||||||||||||||||||||||||||||||||||||||||||||||||||||||||||||||||||||||||||||||||||||||||||||||||||||||||||||||||||||||||||||||||||||||||||||||||||
| User needs | Main users: European Commission (DGs, Secretariat General), Council; Ministry of Education and Science, Ministry of Labour and Social Policy, National Agency for Vocational Education and Training; OECD, UN, CEDEFOP. | ||||||||||||||||||||||||||||||||||||||||||||||||||||||||||||||||||||||||||||||||||||||||||||||||||||||||||||||||||||||||||||||||||||||||||||||||||||||||||||
| User satisfaction | Not available. | ||||||||||||||||||||||||||||||||||||||||||||||||||||||||||||||||||||||||||||||||||||||||||||||||||||||||||||||||||||||||||||||||||||||||||||||||||||||||||||
| Completeness | Not available. | ||||||||||||||||||||||||||||||||||||||||||||||||||||||||||||||||||||||||||||||||||||||||||||||||||||||||||||||||||||||||||||||||||||||||||||||||||||||||||||
| Data completeness - rate | Not applicable. | ||||||||||||||||||||||||||||||||||||||||||||||||||||||||||||||||||||||||||||||||||||||||||||||||||||||||||||||||||||||||||||||||||||||||||||||||||||||||||||
| Accuracy and reliability | |||||||||||||||||||||||||||||||||||||||||||||||||||||||||||||||||||||||||||||||||||||||||||||||||||||||||||||||||||||||||||||||||||||||||||||||||||||||||||||
| Overall accuracy | The overall accuracy is considered as good. | ||||||||||||||||||||||||||||||||||||||||||||||||||||||||||||||||||||||||||||||||||||||||||||||||||||||||||||||||||||||||||||||||||||||||||||||||||||||||||||
| Sampling error | Sampling errors for 2022 AES key statistics are presented in the quality report. | ||||||||||||||||||||||||||||||||||||||||||||||||||||||||||||||||||||||||||||||||||||||||||||||||||||||||||||||||||||||||||||||||||||||||||||||||||||||||||||
| Sampling errors - indicators |
| ||||||||||||||||||||||||||||||||||||||||||||||||||||||||||||||||||||||||||||||||||||||||||||||||||||||||||||||||||||||||||||||||||||||||||||||||||||||||||||
| Non-sampling error | Response rate: AES 2007 - 81.5% AES 2011 - 87.9% AES 2016 - 77.2% AES 2022 - 73.3% | ||||||||||||||||||||||||||||||||||||||||||||||||||||||||||||||||||||||||||||||||||||||||||||||||||||||||||||||||||||||||||||||||||||||||||||||||||||||||||||
| Coverage error | The sampling frame is based on the 2011 Population Census System. Shortcomings:
| ||||||||||||||||||||||||||||||||||||||||||||||||||||||||||||||||||||||||||||||||||||||||||||||||||||||||||||||||||||||||||||||||||||||||||||||||||||||||||||
| Over-coverage - rate | AES 2007: 13.1% households. AES 2011: 6.3% households. AES 2016: 11.0% households. AES 2022: 26.9% households. AES 2022
| ||||||||||||||||||||||||||||||||||||||||||||||||||||||||||||||||||||||||||||||||||||||||||||||||||||||||||||||||||||||||||||||||||||||||||||||||||||||||||||
| Common units - proportion | Not applicable. | ||||||||||||||||||||||||||||||||||||||||||||||||||||||||||||||||||||||||||||||||||||||||||||||||||||||||||||||||||||||||||||||||||||||||||||||||||||||||||||
| Measurement error |
| ||||||||||||||||||||||||||||||||||||||||||||||||||||||||||||||||||||||||||||||||||||||||||||||||||||||||||||||||||||||||||||||||||||||||||||||||||||||||||||
| Non response error | Total unit non-response:
| ||||||||||||||||||||||||||||||||||||||||||||||||||||||||||||||||||||||||||||||||||||||||||||||||||||||||||||||||||||||||||||||||||||||||||||||||||||||||||||
| Unit non-response - rate |
| ||||||||||||||||||||||||||||||||||||||||||||||||||||||||||||||||||||||||||||||||||||||||||||||||||||||||||||||||||||||||||||||||||||||||||||||||||||||||||||
| Item non-response - rate | Item non-response rate more than 10%: AES 2007: None. AES 2011: FEDPAYVAL (10.98%) and NFEPAIDVAL1 (15.26%) AES 2016: NFEPAIDVAL2 (12.87%) and NFEPAUDVAL1 (12.00%) AES 2022: NFEPAIDVAL1 (22.67%) and NFEPAIDVAL2 (12.50%) | ||||||||||||||||||||||||||||||||||||||||||||||||||||||||||||||||||||||||||||||||||||||||||||||||||||||||||||||||||||||||||||||||||||||||||||||||||||||||||||
| Processing error | Not applicable. | ||||||||||||||||||||||||||||||||||||||||||||||||||||||||||||||||||||||||||||||||||||||||||||||||||||||||||||||||||||||||||||||||||||||||||||||||||||||||||||
| Imputation - rate | |||||||||||||||||||||||||||||||||||||||||||||||||||||||||||||||||||||||||||||||||||||||||||||||||||||||||||||||||||||||||||||||||||||||||||||||||||||||||||||
| Model assumption error | Not applicable. | ||||||||||||||||||||||||||||||||||||||||||||||||||||||||||||||||||||||||||||||||||||||||||||||||||||||||||||||||||||||||||||||||||||||||||||||||||||||||||||
| Seasonal adjustment | Not applicable. | ||||||||||||||||||||||||||||||||||||||||||||||||||||||||||||||||||||||||||||||||||||||||||||||||||||||||||||||||||||||||||||||||||||||||||||||||||||||||||||
| Data revision - policy | Not applicable. | ||||||||||||||||||||||||||||||||||||||||||||||||||||||||||||||||||||||||||||||||||||||||||||||||||||||||||||||||||||||||||||||||||||||||||||||||||||||||||||
| Data revision - practice | Not applicable. | ||||||||||||||||||||||||||||||||||||||||||||||||||||||||||||||||||||||||||||||||||||||||||||||||||||||||||||||||||||||||||||||||||||||||||||||||||||||||||||
| Data revision - average size | Not applicable. | ||||||||||||||||||||||||||||||||||||||||||||||||||||||||||||||||||||||||||||||||||||||||||||||||||||||||||||||||||||||||||||||||||||||||||||||||||||||||||||
| Timeliness and punctuality | |||||||||||||||||||||||||||||||||||||||||||||||||||||||||||||||||||||||||||||||||||||||||||||||||||||||||||||||||||||||||||||||||||||||||||||||||||||||||||||
| Timeliness | The reference period for 2022 AES is the 12 months prior to the interview, with exception for the background variables and language module (the moment of interview). | ||||||||||||||||||||||||||||||||||||||||||||||||||||||||||||||||||||||||||||||||||||||||||||||||||||||||||||||||||||||||||||||||||||||||||||||||||||||||||||
| Time lag - first results | Dissemination of the national results at the NSI’s website: AES 2011 - 07.07.2010 AES 2016 - 15.09.2017 AES 2022 - 14.09.2023 | ||||||||||||||||||||||||||||||||||||||||||||||||||||||||||||||||||||||||||||||||||||||||||||||||||||||||||||||||||||||||||||||||||||||||||||||||||||||||||||
| Time lag - final results | Not applicable (only final data). | ||||||||||||||||||||||||||||||||||||||||||||||||||||||||||||||||||||||||||||||||||||||||||||||||||||||||||||||||||||||||||||||||||||||||||||||||||||||||||||
| Punctuality | Project phases - dates
| ||||||||||||||||||||||||||||||||||||||||||||||||||||||||||||||||||||||||||||||||||||||||||||||||||||||||||||||||||||||||||||||||||||||||||||||||||||||||||||
| Punctuality - delivery and publication | Not applicable. | ||||||||||||||||||||||||||||||||||||||||||||||||||||||||||||||||||||||||||||||||||||||||||||||||||||||||||||||||||||||||||||||||||||||||||||||||||||||||||||
| Coherence and comparability | |||||||||||||||||||||||||||||||||||||||||||||||||||||||||||||||||||||||||||||||||||||||||||||||||||||||||||||||||||||||||||||||||||||||||||||||||||||||||||||
| Comparability - geographical | Full comparability with all EU member states. | ||||||||||||||||||||||||||||||||||||||||||||||||||||||||||||||||||||||||||||||||||||||||||||||||||||||||||||||||||||||||||||||||||||||||||||||||||||||||||||
| Asymmetry for mirror flows statistics - coefficient | Not applicable. | ||||||||||||||||||||||||||||||||||||||||||||||||||||||||||||||||||||||||||||||||||||||||||||||||||||||||||||||||||||||||||||||||||||||||||||||||||||||||||||
| Comparability - over time | Partial comparability between the different waves of the survey due to differences in the overall methodology. 2011 AES collected INF differently and is therefore not comparable with the other waves. | ||||||||||||||||||||||||||||||||||||||||||||||||||||||||||||||||||||||||||||||||||||||||||||||||||||||||||||||||||||||||||||||||||||||||||||||||||||||||||||
| Length of comparable time series | Not applicable. | ||||||||||||||||||||||||||||||||||||||||||||||||||||||||||||||||||||||||||||||||||||||||||||||||||||||||||||||||||||||||||||||||||||||||||||||||||||||||||||
| Coherence - cross domain |
| ||||||||||||||||||||||||||||||||||||||||||||||||||||||||||||||||||||||||||||||||||||||||||||||||||||||||||||||||||||||||||||||||||||||||||||||||||||||||||||
| Coherence - sub annual and annual statistics | Not applicable. | ||||||||||||||||||||||||||||||||||||||||||||||||||||||||||||||||||||||||||||||||||||||||||||||||||||||||||||||||||||||||||||||||||||||||||||||||||||||||||||
| Coherence - National Accounts | Not applicable. | ||||||||||||||||||||||||||||||||||||||||||||||||||||||||||||||||||||||||||||||||||||||||||||||||||||||||||||||||||||||||||||||||||||||||||||||||||||||||||||
| Coherence - internal | AES results for a given data collection round are based on the same microdata and results are calculated using the same estimation methods, therefore the data are internally coherent. | ||||||||||||||||||||||||||||||||||||||||||||||||||||||||||||||||||||||||||||||||||||||||||||||||||||||||||||||||||||||||||||||||||||||||||||||||||||||||||||
| Accessibility and clarity | |||||||||||||||||||||||||||||||||||||||||||||||||||||||||||||||||||||||||||||||||||||||||||||||||||||||||||||||||||||||||||||||||||||||||||||||||||||||||||||
| News release | Press releases were published at the NSI’s website: AES 2016: www.nsi.bg/en/node/15477/ AES 2022: www.nsi.bg/en/node/20763/ | ||||||||||||||||||||||||||||||||||||||||||||||||||||||||||||||||||||||||||||||||||||||||||||||||||||||||||||||||||||||||||||||||||||||||||||||||||||||||||||
| Publications | AES 2007: https://nsi.bg/en/node/3385/ | ||||||||||||||||||||||||||||||||||||||||||||||||||||||||||||||||||||||||||||||||||||||||||||||||||||||||||||||||||||||||||||||||||||||||||||||||||||||||||||
| On-line database | Information System INFOSTAT of the National Statistical Institute: | ||||||||||||||||||||||||||||||||||||||||||||||||||||||||||||||||||||||||||||||||||||||||||||||||||||||||||||||||||||||||||||||||||||||||||||||||||||||||||||
| Data tables - consultations | Not applicable. | ||||||||||||||||||||||||||||||||||||||||||||||||||||||||||||||||||||||||||||||||||||||||||||||||||||||||||||||||||||||||||||||||||||||||||||||||||||||||||||
| Micro-data access | In accordance with the internal (for the NSI) Rules for Provision of Anonymised Individual Data for Scientific and Research Purposes (https://www.nsi.bg/en/node/12152/). | ||||||||||||||||||||||||||||||||||||||||||||||||||||||||||||||||||||||||||||||||||||||||||||||||||||||||||||||||||||||||||||||||||||||||||||||||||||||||||||
| Other | Not available. | ||||||||||||||||||||||||||||||||||||||||||||||||||||||||||||||||||||||||||||||||||||||||||||||||||||||||||||||||||||||||||||||||||||||||||||||||||||||||||||
| Metadata - consultations | Not applicable. | ||||||||||||||||||||||||||||||||||||||||||||||||||||||||||||||||||||||||||||||||||||||||||||||||||||||||||||||||||||||||||||||||||||||||||||||||||||||||||||
| Documentation on methodology | Metadata and methodological notes were published on the NSI’s website: https://www.nsi.bg/en/node/4936/ and the 2022 AES implementation manual (http://ec.europa.eu/eurostat/web/education-and-training/methodology). | ||||||||||||||||||||||||||||||||||||||||||||||||||||||||||||||||||||||||||||||||||||||||||||||||||||||||||||||||||||||||||||||||||||||||||||||||||||||||||||
| Metadata completeness – rate | Not applicable. | ||||||||||||||||||||||||||||||||||||||||||||||||||||||||||||||||||||||||||||||||||||||||||||||||||||||||||||||||||||||||||||||||||||||||||||||||||||||||||||
| Quality documentation | The national quality report was published at the NSI’s website: https://www.nsi.bg/en/node/15103/ | ||||||||||||||||||||||||||||||||||||||||||||||||||||||||||||||||||||||||||||||||||||||||||||||||||||||||||||||||||||||||||||||||||||||||||||||||||||||||||||
| Cost and burden | |||||||||||||||||||||||||||||||||||||||||||||||||||||||||||||||||||||||||||||||||||||||||||||||||||||||||||||||||||||||||||||||||||||||||||||||||||||||||||||
Staff involved in conducting the survey (AES 2022): 5 experts from the NSI's Education and Culture Statistics Department - responsible for survey organization, implementation of methodology, preparation of the national questionnaire and interviewers manual, sampling, training of regional coordinators, data processing, preparation of EU dataset and quality report, data dissemination; 3 experts from the NSI's Information Systems and Application Software Department - responsible for preparation of the interviewing application; 28 regional coordinators from the Regional Statistical Offices - responsible for organization of the fieldwork, training of the interviewers and supervision of the fieldwork. | |||||||||||||||||||||||||||||||||||||||||||||||||||||||||||||||||||||||||||||||||||||||||||||||||||||||||||||||||||||||||||||||||||||||||||||||||||||||||||||
| Confidentiality | |||||||||||||||||||||||||||||||||||||||||||||||||||||||||||||||||||||||||||||||||||||||||||||||||||||||||||||||||||||||||||||||||||||||||||||||||||||||||||||
| Confidentiality - policy | According to the Law on Statistics (Articles 25 and 26). | ||||||||||||||||||||||||||||||||||||||||||||||||||||||||||||||||||||||||||||||||||||||||||||||||||||||||||||||||||||||||||||||||||||||||||||||||||||||||||||
| Confidentiality – data treatment | According to the Law on Statistics (Articles 25 and 26). | ||||||||||||||||||||||||||||||||||||||||||||||||||||||||||||||||||||||||||||||||||||||||||||||||||||||||||||||||||||||||||||||||||||||||||||||||||||||||||||
| Comment | |||||||||||||||||||||||||||||||||||||||||||||||||||||||||||||||||||||||||||||||||||||||||||||||||||||||||||||||||||||||||||||||||||||||||||||||||||||||||||||
Download in SDMX 2.1 file format: Adult Education Survey
Metadata Structure Definition in SDMX 2.1: ESQRS_MSD+BNSI+2.0+SDMX.2.1.xml
Download in SDMX 2.0 file format: Adult Education Survey
Metadata Structure Definition in SDMX 2.0: ESQRS_MSD+BNSI+2.0+SDMX.2.0.xml
Education in the Republic of Bulgaria for 2023/2024 School Year
The main results from the National Statistical Institute (NSI) annual comprehensive surveys characterizing the activity of educational institutions are as follows:
- In 2023/2024 school year in pre-primary education (kindergartens and preparatory groups at schools) were enrolled 216.9 thousand children.
- In 2023, the number of basic education graduates was 63.4 thousand students and the number of upper-secondary education graduates from general and vocational programmes was respectively 24.2 and 15.4 thousand students.
- In 2023/2024 academic year, there w...
Main results from the Adult Education Survey 2022 (preliminary data)
Adult Education Survey is conducted every 5 years in all EU member states through a common methodology and a harmonized questionnaire in accordance with Commission Regulation (EU) № 2019/1700 of 10 October 2019.
According to the survey, 637.9 thousand persons (18.9%) aged 25 - 64 participated in at least one non-formal training in the last 12 months. Compared with the previous survey wave, there was a decrease of 3.6 percentage points. While almost every third person (31.1%) with a tertiary education has participated in at least one non-formal training, this share is 4.7% for thos...
Education in the Republic of Bulgaria for 2022/2023 School Year
The main results from the National Statistical Institute (NSI) annual comprehensive surveys characterizing the activity of educational institutions are as follows:
- In 2022/2023 school year in pre-primary education (kindergartens and preparatory groups at schools) were enrolled 216.5 thousand children.
- In 2022, the number of basic education graduates was 61.1 thousand students and the number of upper-secondary education graduates from general and vocational programmes were respectively 23.2 and 13.2 thousand students.
- In 2022/2023 academic year, there ...
Education in the Republic of Bulgaria for 2021/2022 School Year
The main results from the National Statistical Institute (NSI) annual comprehensive surveys characterizing the activity of educational institutions are as follows:
- In 2021/2022 school year in pre-primary education (kindergartens and preparatory groups at schools) were enrolled 214.8 thousand children.
- In 2021, the number of basic education graduates was 58.3 thousand students and graduates from general and vocational schools were respectively 25.2 and 17.8 thousand students.
- In 2021/2022 academic year, there were 220.4 thousand students enrolled at th...
Education in the Republic of Bulgaria for 2020/2021 School Year
The main results from the National Statistical Institute annual comprehensive surveys characterizing the activity of educational institutions are as follows:
- In 2020/2021 school year in pre-primary education (kindergartens and preparatory groups at schools) were enrolled 215.7 thousand children.
- In 2020, the number of basic education graduates was 59.9 thousand students and graduates from general and vocational schools were respectively 25.5 and 19.6 thousand students.
- In 2020/2021 academic year, there were 219.8 thousand students enrolled in the diff...
Education in the Republic of Bulgaria for 2019/2020 School Year
The main results from the National Statistical Institute (NSI) annual comprehensive surveys characterizing the activity of educational institutions are as follows:
- In the 2019/2020 academic year in kindergartens are enrolled 217.9 thousand children or with 0.4% less in comparison with the previous year.
- In 2019, high school graduates from general and vocational schools are respectively 25.8 and 21.6 thousand students.
- In 2019/2020 academic year, 220.2 thousand persons were enrolled in the different tertiary education levels.
- As of 31.1...
Education in the Republic of Bulgaria for 2018/2019 School Year
The main results from the National Statistical Institute (NSI) annual comprehensive surveys characterizing the activity of educational institutions are as follows:
- In the 2018/2019 academic year in kindergartens are enrolled 218.8 thousand children or with 1.0% less in comparison with the previous year.
- In 2018, high school graduates from general and vocational schools are respectively 26.5 and 23.0 thousand students.
- Enrolled in the varying degrees of higher education in 2018/2019 academic year are 229.5 thousand persons.
- As of 31.12.2018 for acquiring ed...
Education in the Republic of Bulgaria for 2017/2018 School Year
The main results from the National Statistical Institute annual comprehensive surveys characterizing the activity of educational institutions are as follows:
- In the 2017/2018 academic year in kindergartens are enrolled 220.9 thousand children or with 1.6% less in comparison with the previous year.
- In 2017, upper-secondary graduates in general and vocational schools are respectively 26.6 thousand and 21.7 thousand students.
- Enrolled in the varying degrees of higher education in 2017/2018 academic year are 236.3 thousand.
- As of 31.12.2017 for acquiring educa...
Main results from the Adult Education Survey (third wave, 2016)
Adult Education Survey is conducted once every five years in all EU Member States through a common methodology and a harmonized toolkit that provides comparable data for assessment on lifelong learning.
The National Statistical Institute presents final results from the survey conducted in the end of 2016.
...Education in the Republic of Bulgaria for 2016/2017 School Year
The main results from the National Statistical Institute (NSI) annual comprehensive studies characterizing the activity of educational institutions are as follows:
• In the 2016/2017 academic year in kindergartens are enrolled 224.4 thousand children or with 3.3% less in comparison with the previous year.
Education in the Republic of Bulgaria for 2015/2016 School Year
The main results from the National Statistical Institute (NSI) annual comprehensive studies characterizing the activity of educational institutions are as follows:
• In the 2015/2016 academic year in kindergartens are enrolled 232.0 thousand children or with 3.8% less in comparison with the previous year.
Education in the Republic of Bulgaria for 2014/2015 School Year
The main results of the yearly exhaustive surveys that characterize the activity of the educational institutions, conducted by the National Statistical Institute (NSI), are:
• The number of children in kindergartens for 2014/2015 was 241.1 thousand as an increase of 0.2% is observed in comparison with the previous school year.
Education in the Republic of Bulgaria for 2013/2014 School Year
The main results of the yearly exhaustive surveys that characterize the activity of the educational institutions, conducted by the National Statistical Institute, are:
- The number of children in kindergartens for 2013/2014 was 240.6 thousand as an increase of 2.4% is observed in comparison with the previous school year.
- In 2013, 28.9 and 27.4 thousand students graduated secondary education in respectively general and vocational schools.
- For the 2013/2014 academic year, the number of enrollments in higher education remained almost unchange...
Education in the Republic of Bulgaria for 2012/2013 School Year
The main results of the yearly exhaustive surveys that characterize the activity of the educational institutions, conducted by the National Statistical Institute (NSI), are:
• The number of children in kindergartens for 2012/2013 was 235.0 thousand as an increase of 3.1% is observed in comparison with the previous school year.
• In 2012, 30.3 and 29.4 thousand students graduated secondary education in respectively general and vocational schools.
• For the 2012/2013 academic year, the number of enrollments in higher education remained almost unchanged in comparison with the previous academ...
Participation of the Population Aged 25 - 64 in Lifelong Learning (Analysis of the Main Results of the Adult Education Survey 2011)
Adult Education Survey covers broad range of topics, connected to the education and training of adults, like participation in different forms of Lifelong Learning (formal, non-formal and informal), reasons for non-participation, access to information on possibilities for education and training, use of computers, language skills, participation in cultural and social events....
Education in the Republic of Bulgaria for 2011/2012 School Year
The educational structure of population aged 7 and more improves considerably, following the clearly expressed tendency of increase of the number and share of population with tertiary and upper secondary education and decrease the number of people with lower secondary or lower education.
As of 1.02.2011 the Population census results shows 1 348.7 thousand persons with tertiary education, or each fifth person (19.6%). With upper secondary education are 2 990.4 thousand persons (43.4%). The proportion of persons with primary or lower education is 13.9% (or every seventh in 100).
...
Education in the Republic of Bulgaria for 2010/2011 School Year
During the 2006 - 2010 period the educational attainment of the population aged 25 - 64 continues to improve following the clear-cut tendency towards an increase of the number and share of the population with tertiary and secondary education together with the decrease of the number and share of people with primary and lower education. The relative share of the population with tertiary education (college and university) increased from 21.9% in 2006 to 23.2% in 2010 or by 1.3 points and the share of the population with secondary education increased from 52.5 to 56.2% or by 3.7 points. Parallel t...
Education in the Republic of Bulgaria 2024
The National Statistical Institute presents to the attention of users interested in social statistics the newest annual bilingual (Bulgarian and English) electronic publication Education in the Republic of Bulgaria 2024.
The publication contains main data from the annual comprehensive statistical observations characterizing the activity of educational institutions in Bulgaria in the period 2019 - 2023.
The publication includes data on kindergartens, educational institutions, students in different types of schools, teachers, students - Bulgarian and forei...
Statistical Reference Book 2024

Тhe National Statistical Institute presents to the users of statistical information the annual publication - Statistical Reference Book 2024 in English.
The Statistical Reference Book presents up-to-date information on the demographic processes as well as the economic, social and cultural development of the Republic of Bulgaria for the 2019 - 2023 period.
The publication presents data on main macroeconomic indicators of the national economy - gross domestic product, investments and finance; and economic acti...
Statistical Reference Book 2024 (Bulgarian version)
The National Statistical Institute presents to users of statistical information the annual publication - Statistical Reference Book 2024 in Bulgarian.
The Statistical Reference Book presents up-to-date information on the demographic processes as well as the economic, social and cultural development of the Republic of Bulgaria for the 2019 - 2023 period.
The publication presents data on main macroeconomic indicators of the national economy - gross domestic product, investments and finance; and economic activity groupings - industry, agriculture, forestry,...
Statistical Yearbook 2023
The National Statistical Institute (NSI) has the pleasure to present to the attention of national and foreign users of statistical information the 91-st edition of the ‘Statistical Yearbook of the Republic of Bulgaria’ in printed format.
It provides current statistical information about the demographic, economic and social development of the country for 2017 - 2022 in different territorial and classification aggregations and breakdowns.
According to the Law on Statistics, official source of information in the Republic of Bulgaria is the National Statistical Sys...
Education in the Republic of Bulgaria 2023
The National Statistical Institute presents to the attention of users interested in social statistics the newest annual bilingual (Bulgarian and English) electronic publication Education in the Republic of Bulgaria 2023.
The publication contains main data from the five carried out annual comprehensive statistical surveys, which characterizing the activity of educational institutions in Bulgaria for the period from 2018/2019 to 2022/2023 school (academic) years.
The issue presents a broad range of data about kindergartens, education institutions, pupils b...
Statistical Reference Book 2023 (Bulgarian version)
The National Statistical Institute presents to users of statistical information the annual publication - Statistical Reference Book 2023 in Bulgarian.
The Statistical Reference Book presents topical information on the demographic processes as well as the economic, social and cultural development of the Republic of Bulgaria for the 2018 - 2022 period.
The publication presents data on main macroeconomic indicators of the national economy - gross domestic product, investments and finance; and economic activity groupings ...
Statistical Reference Book 2023
The National Statistical Institute presents to users of statistical information the annual publication - Statistical Reference Book 2023 in English.
The Statistical Reference Book presents topical information on the demographic processes as well as the economic, social and cultural development of the Republic of Bulgaria for the 2018 - 2022 period.
The publication presents data on main macroeconomic indicators of the national economy - gross domestic product, investments and finance; and economic activity groupings - industry, agriculture, fore...
Statistical Yearbook 2022
The National Statistical Institute (NSI) has the pleasure to present to the attention of national and foreign users of statistical information the 90th edition of the ‘Statistical Yearbook of the Republic of Bulgaria’ in printed format.
It provides current statistical information about the demographic, economic and social development of the country for 2016 - 2021 in different territorial and classification aggregations and breakdowns.
According to the Law on Statistics, official source of information in the Republic of Bulgaria is the National Statistical ...
Education in the Republic of Bulgaria 2022

The National Statistical Institute presents to the attention of users interested in social statistics the newest annual bilingual (Bulgarian and English) electronic publication Education in the Republic of Bulgaria 2022.
The publication contains main data from the five carried out annual comprehensive statistical surveys, which characterizing the activity of educational institutions in Bulgaria for the period from 2017/2018 to 2021/2022 school (academic) years.
The issue presents a broad range of data about kindergartens, ...
Statistical Reference Book 2022
The National Statistical Institute presents to users of statistical information the annual publication - Statistical Reference Book 2022 in English.
The Statistical Reference Book presents topical information on the demographic processes as well as the economic, social and cultural development of the Republic of Bulgaria for the 2017 - 2021 period.
The publication presents data on main macroeconomic indicators of the national economy - gross domestic product, investments and finance; and economic activity groupings - industry, agriculture, ...
Statistical Reference Book 2022 (Bulgarian version)
The National Statistical Institute presents to users of statistical information the annual publication - Statistical Reference Book 2022 in Bulgarian.
The Statistical Reference Book presents topical information on the demographic processes as well as the economic, social and cultural development of the Republic of Bulgaria for the 2017 - 2021 period.
The publication presents data on main macroeconomic indicators of the national economy - gross domestic product, investments and finance; and economic activity groupings - industry, agriculture, fo...
Statistical Yearbook 2021
The National Statistical Institute (NSI) has the pleasure to present to the attention of national and foreign users of statistical information the 89th edition of the ‘Statistical Yearbook of the Republic of Bulgaria’ in printed and electronic format.
It provides current statistical information about the demographic, economic and social development of the country for 2015 - 2020 in different territorial and classification aggregations and breakdowns.
According to the Law on Statistics, official source of information in the Republic of Bulgaria is the ...
Education in the Republic of Bulgaria 2021

The National Statistical Institute presents to the attention of users interested in social statistics the newest annual bilingual (Bulgarian and English) electronic publication Education in the Republic of Bulgaria 2021.
The publication contains main data from the five carried out annual comprehensive statistical surveys, which characterizing the activity of educational institutions in Bulgaria for the period from 2016/2017 to 2020/2021 school (academic) years.
The issue presents a broad range of data about kindergartens, education institutions, pupils b...
Statistical Reference Book 2021
The National Statistical Institute presents to users of statistical information the annual publication - Statistical Reference Book 2021 in English.
The Statistical Reference Book presents topical information on the demographic processes as well as the economic, social and cultural development of the Republic of Bulgaria for the 2016 - 2020 period.
The publication presents data on main macroeconomic indicators of the national economy - gross domestic product, investments and finance; and economic activity groupings - industry, agriculture, forestry, ...
Statistical Reference Book 2021 (Bulgarian version)

The National Statistical Institute presents to users of statistical information the annual publication - Statistical Reference Book 2021 in Bulgarian.
The Statistical Reference Book presents topical information on the demographic processes as well as the economic, social and cultural development of the Republic of Bulgaria for the 2016 - 2020 period.
The publication presents data on main macroeconomic indicators of the national economy - gross domestic product, investments and finance; and economic activity groupings - industry, agri...
Statistical Yearbook 2020
The National Statistical Institute (NSI) has the pleasure to present to the attention of national and foreign users of statistical information the 88th edition of the ‘Statistical Yearbook of the Republic of Bulgaria’ in printed and electronic format.
It provides current statistical information about the demographic, economic and social development of the country for 2014 - 2019 in different territorial and classification aggregations and breakdowns.
According to the Law on Statistics, official source of information in the Republic of Bulgaria is the ...
Statistical Yearbook 2012

The National Statistical Institute (NSI) has the pleasure to submit to the attention of national and foreign users of statistical information the 80th edition of the ‘Statistical Yearbook of the Republic of Bulgaria’ in printed and electronic format.
It provides current statistical information about the demographic, economic and social development of the country for the 2007 - 2011 period in different territorial and classification aggregations and breakdowns.
Accor...
Education in the Republic of Bulgaria 2020

The National Statistical Institute presents to the attention of users interested in social statistics the newest annual bilingual (Bulgarian and English) electronic publication Education in the Republic of Bulgaria 2020.
The publication contains main data from the five carried out annual comprehensive statistical surveys, which characterizing the activity of educational institutions in Bulgaria for the period from 2015/2016 to 2019/2020 school (academic) years.
The issue presents a broad range of data about kindergartens, education institutions, pupils by di...
Statistical Reference Book 2020
The National Statistical Institute presents to users of statistical information the annual publication - Statistical Reference Book 2020 in English.
The Statistical Reference Book presents topical information on the demographic processes as well as the economic, social and cultural development of the Republic of Bulgaria for the 2016 - 2019 period.
The publication presents data on main macroeconomic indicators of the national economy - gross domestic product, investments and finance; and economic activity groupings - industry, agriculture, forestry, ...
Statistical Reference Book 2020 (Bulgarian version)
The National Statistical Institute presents to users of statistical information the annual publication - Statistical Reference Book 2020 in Bulgarian.
The Statistical Reference Book presents topical information on the demographic processes as well as the economic, social and cultural development of the Republic of Bulgaria for the 2016 - 2019 period.
The publication presents data on main macroeconomic indicators of the national economy - gross domestic product, investments and finance; and economic activity groupings - industry, agriculture,...
Statistical Yearbook 2019
The National Statistical Institute (NSI) has the pleasure to present to the attention of national and foreign users of statistical information the 87th edition of the ‘Statistical Yearbook of the Republic of Bulgaria’ in printed and electronic format.
It provides current statistical information about the demographic, economic and social development of the country for 2013 - 2018 in different territorial and classification aggregations and breakdowns.
According to the Law on Statistics, official source of information in the Republic of Bulgaria is the ...
Education in the Republic of Bulgaria 2019

The National Statistical Institute presents to the attention of users interested in social statistics the newest annual bilingual (Bulgarian and English) electronic publication Education in the Republic of Bulgaria 2019.
The publication contains main data from the five carried out annual comprehensive statistical surveys, which characterizing the activity of educational institutions in Bulgaria for the period from 2014/2015 to 2018/2019 school (academic) years.
The issue presents a broad range of data about kindergartens, education institutions, pupils by di...
Statistical Yearbook 2018 in infographics
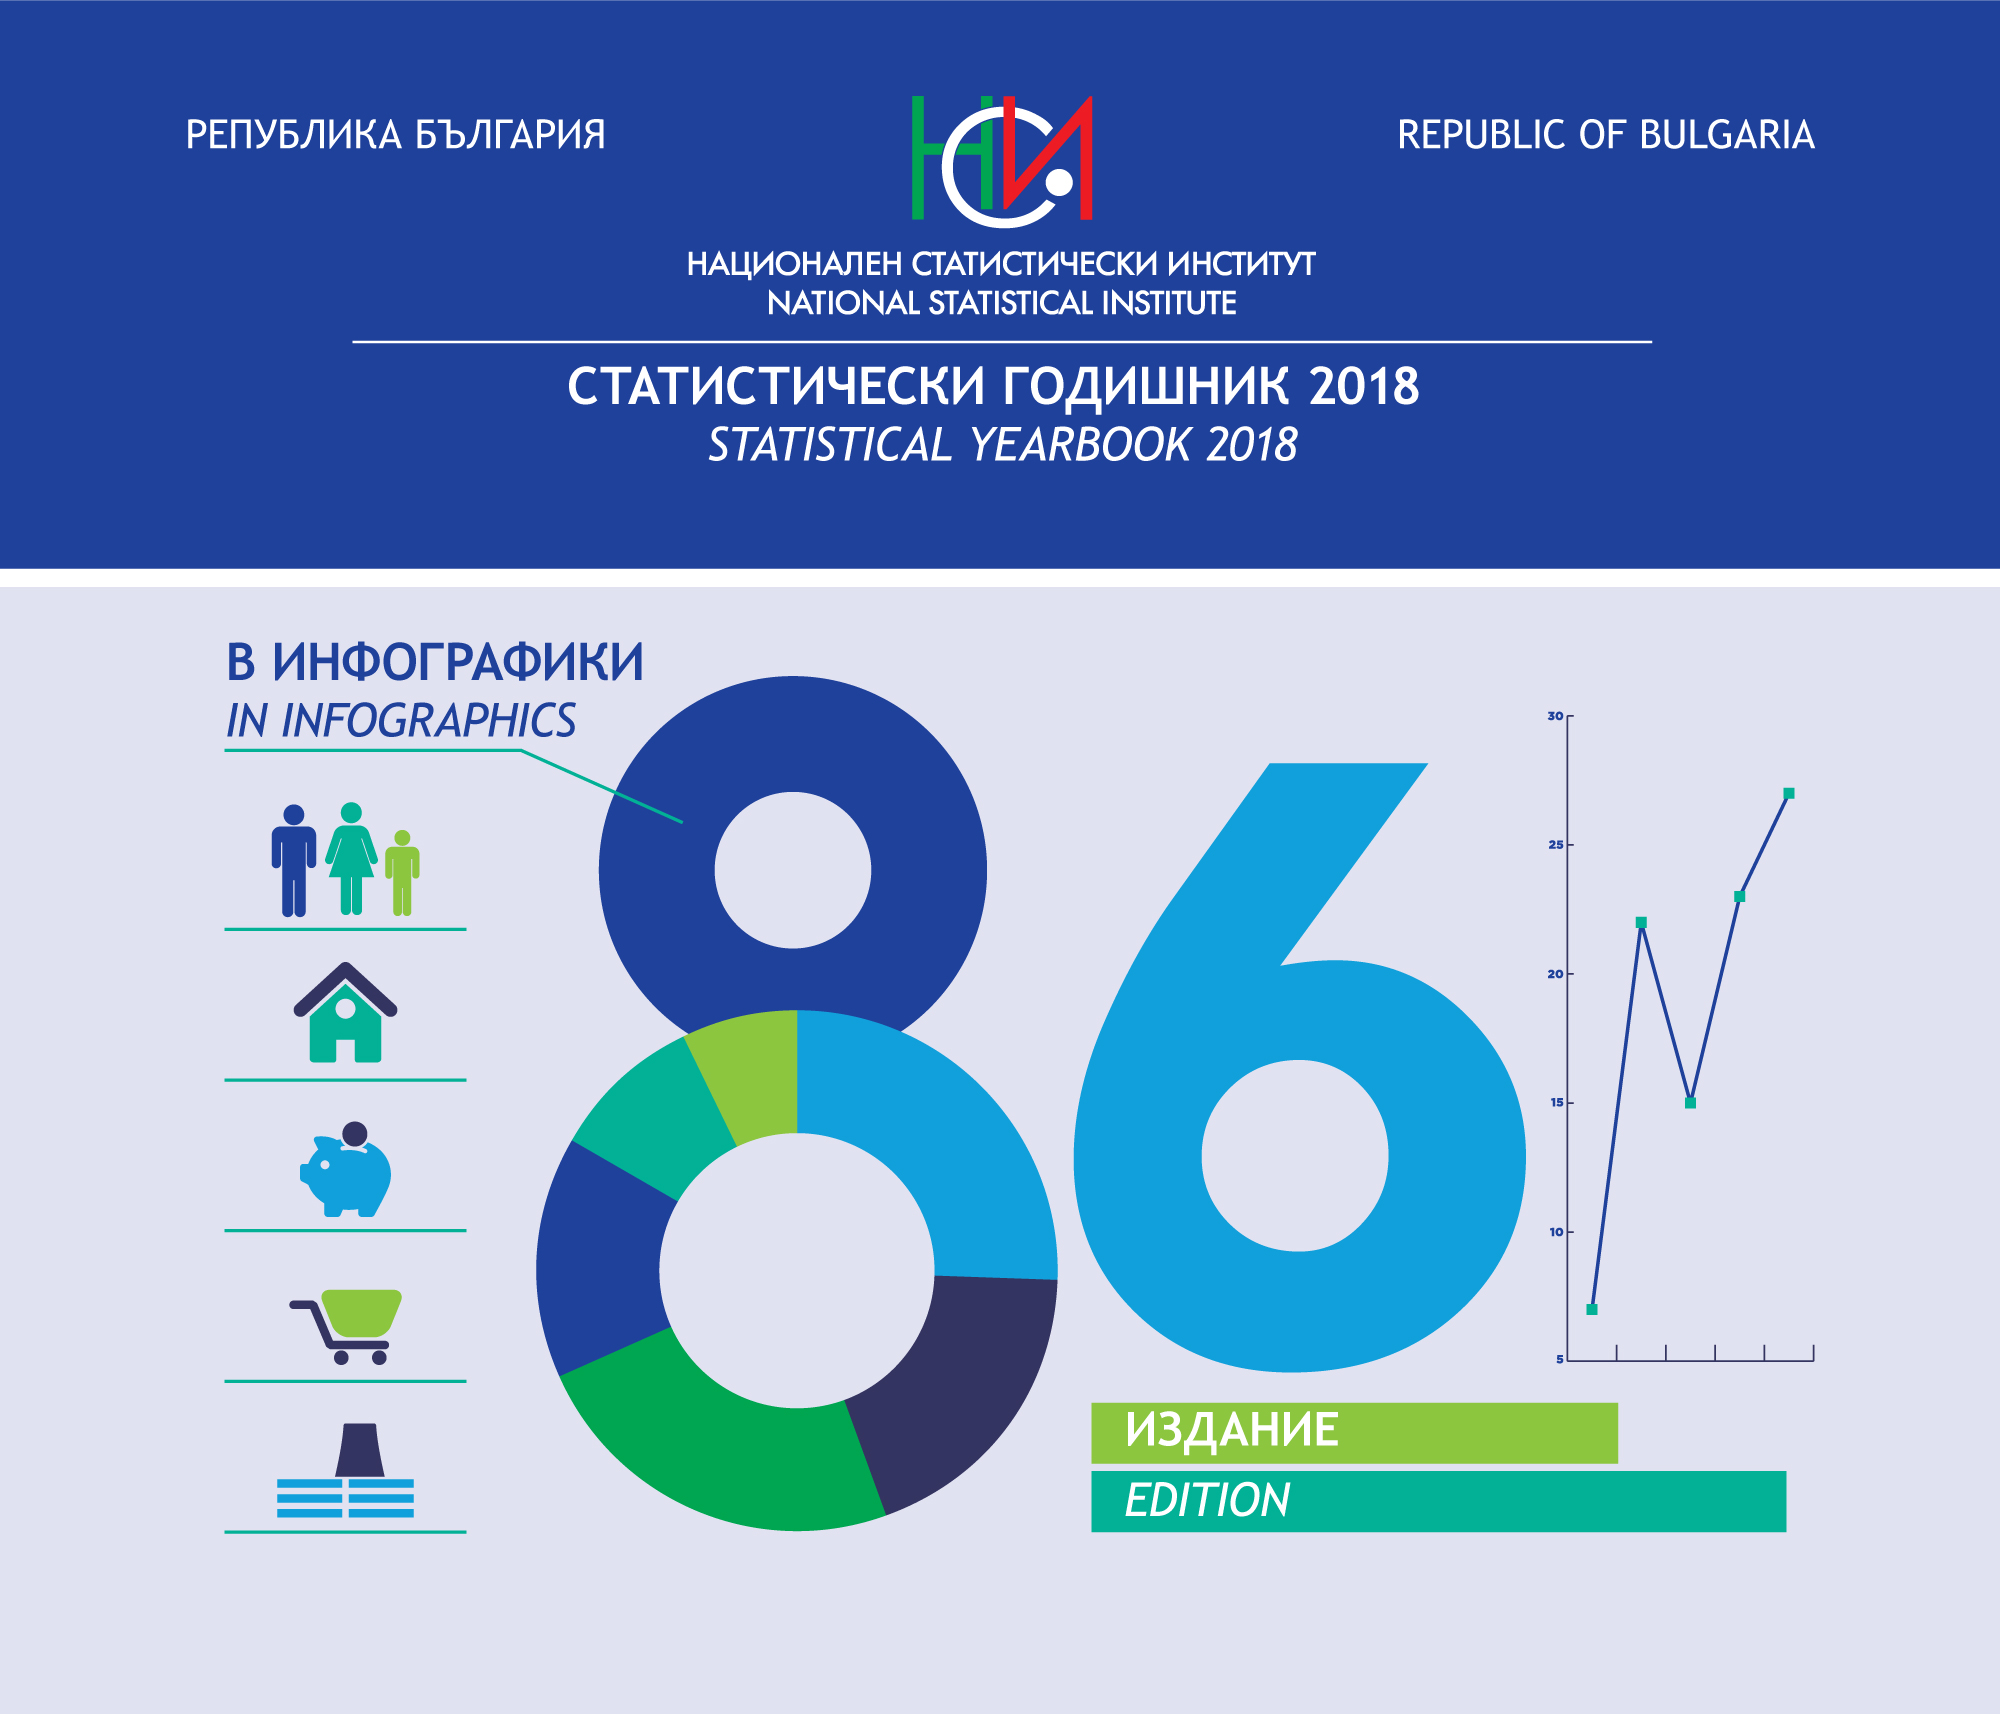
The National Statistical Institute presents to your attention the 86th edition of the Statistical Yearbook of the Republic of Bulgaria in infographics.
In 2018, for the first time, we presented the results of the statistical surveys through graphics, images and other visualization tools, which resulted in a positive response among a wide range of users. We believe that this modern way of presenting statistical information will trigger the interest in those who for the first time encounter the meaning of numbers revealing important aspects of socio-economic life.
...Statistical Reference Book 2019

The National Statistical Institute presents to users of statistical information the annual publication - Statistical Reference Book 2019 in English.
The Statistical Reference Book presents topical information on the demographic processes as well as the economic, social and cultural development of the Republic of Bulgaria for the 2015 - 2018 period.
The publication presents data on main macroeconomic indicators of the national economy - gross domestic product, investments and finance; and economic activity groupings - industry, agriculture, f...
Statistical Reference Book 2019 (Bulgarian version)

The National Statistical Institute presents to users of statistical information the annual publication - Statistical Reference Book 2019 in Bulgarian.
The Statistical Reference Book presents topical information on the demographic processes as well as the economic, social and cultural development of the Republic of Bulgaria for the 2015 - 2018 period.
The publication presents data on main macroeconomic indicators of the national economy - gross domestic product, investments and finance; and economic activity groupings - industry, agriculture, forestry, transp...
Statistical Yearbook 2018

The National Statistical Institute (NSI) has the pleasure to present to the attention of national and foreign users of statistical information the 86th edition of the ‘Statistical Yearbook of the Republic of Bulgaria’ in printed and electronic format.
It provides current statistical information about the demographic, economic and social development of the country for 2012 - 2017 in different territorial and classification aggregations and breakdowns.
According to the Law on Statistics, official source of information in the Republic of Bulgaria is the ...
Education in the Republic of Bulgaria 2018
The National Statistical Institute presents to the attention of users interested in social statistics the newest annual bilingual (Bulgarian and English) electronic publication Education in the Republic of Bulgaria 2018.
The publication contains main data from the five carried out annual comprehensive statistical surveys, which characterizing the activity of educational institutions in Bulgaria for the period from 2013/2014 to 2017/2018 school (academic) years.
The issue presents a broad range of data about kindergartens, education institutions, pupils by di...
Statistical Reference Book 2018
The National Statistical Institute presents to users of statistical information the annual publication - Statistical Reference Book 2018 in English.
The Statistical Reference Book presents topical information on the demographic processes as well as the economic, social and cultural development of the Republic of Bulgaria for the 2014 - 2017 period.
The publication presents data on main macroeconomic indicators of the national economy - gross domestic product, investments and finance; and economic activity groupings - industry, agriculture, f...
Statistical Yearbook 2017 in infographics

The National Statistical Institute of Bulgaria offers a different view of the statistical information included in the 85th edition of the Statistical Yearbook of the Republic of Bulgaria.
The publication is intended for a wider audience as statistical data are presented in a plain and easy understandable way.
The current state and changes in the socio-economic and cultural life in the country are presented not in the traditional way in tables and text, but through infographics - images, graphics and other visualization tools.
We belie...
Statistical Reference Book 2018 (Bulgarian version)

The National Statistical Institute presents to users of statistical information the annual publication - Statistical Reference Book 2018 in Bulgarian.
The Statistical Reference Book presents topical information on the demographic processes as well as the economic, social and cultural development of the Republic of Bulgaria for the 2014 - 2017 period.
The publication presents data on main macroeconomic indicators of the national economy - gross domestic product, investments and finance; and economic activity groupings - industry, agriculture, forestry, transp...
Statistical Yearbook 2017
The National Statistical Institute (NSI) has the pleasure to present to the attention of national and foreign users of statistical information the 84th edition of the ‘Statistical Yearbook of the Republic of Bulgaria’ in printed and electronic format.
It provides current statistical information about the demographic, economic and social development of the country for 2012 - 2016 in different territorial and classification aggregations and breakdowns.
According to the Law on Statistics, official source of information in the Republic of Bulgaria is the ...
Education in the Republic of Bulgaria 2017

The National Statistical Institute presents to the attention of users interested in social statistics the newest annual bilingual (Bulgarian and English) electronic publication Education in the Republic of Bulgaria 2017.
The publication contains main data from the five carried out annual comprehensive statistical surveys, which characterizing the activity of educational institutions in Bulgaria for the period from 2012/2013 to 2016/2017 school (academic) years.
The issue presents a broad range of data about kindergartens, education institutions, pupils by di...
Statistical Reference Book 2017
The National Statistical Institute presents to users of statistical information the annual publication - Statistical Reference Book 2017 in English.
The Statistical Reference Book presents topical information on the demographic processes as well as the economic, social and cultural development of the Republic of Bulgaria for the 2013 - 2016 period.
The publication presents data on main macroeconomic indicators of the national economy - gross domestic product, investments and finance; and economic activity groupings - industry, agriculture, f...
Statistical Reference Book 2017 (Bulgarian version)

The National Statistical Institute presents to users of statistical information the annual publication - Statistical Reference Book 2017 in Bulgarian.
The Statistical Reference Book presents topical information on the demographic processes as well as the economic, social and cultural development of the Republic of Bulgaria for the 2013 - 2016 period.
The publication presents data on main macroeconomic indicators of the national economy - gross domestic product, investments and finance; and economic activity groupings - industry, agriculture, forestry, transp...
Statistical Yearbook 2016
The National Statistical Institute (NSI) has the pleasure to present to the attention of national and foreign users of statistical information the 84th edition of the ‘Statistical Yearbook of the Republic of Bulgaria’ in printed and electronic format.
It provides current statistical information about the demographic, economic and social development of the country for 2011 - 2015 in different territorial and classification aggregations and breakdowns.
According to the Law on Statistics, official source of information in the Republic of Bulgaria is the ...
Education in the Republic of Bulgaria 2016

The National Statistical Institute presents to the attention of users interested in social statistics the newest annual bilingual (Bulgarian and English) electronic publication Education in the Republic of Bulgaria 2016.
The publication contains main data from the five carried out annual comprehensive statistical surveys, which characterizing the activity of educational institutions in Bulgaria for the period from 2011/2012 to 2015/2016 school (academic) years.
The issue presents a broad range of data about kindergartens, education institutions, pupils by di...
Statistical Reference Book 2016

The National Statistical Institute presents to users of statistical information the annual publication - Statistical Reference Book 2016 in English.
The Statistical Reference Book presents topical information on the demographic processes as well as the economic, social and cultural development of the Republic of Bulgaria for the 2012 - 2015 period.
The publication presents data on main macroeconomic indicators of the national economy - gross domestic product, investments and finance; and economic activity groupings - industry, agriculture, forestry, transpor...
Statistical Reference Book 2016 (Bulgarian version)
The National Statistical Institute presents to users of statistical information the annual publication - Statistical Reference Book 2016 in Bulgarian.
The Statistical Reference Book presents topical information on the demographic processes as well as the economic, social and cultural development of the Republic of Bulgaria for the 2012 - 2015 period.
The publication presents data on main macroeconomic indicators of the national economy - gross domestic product, investments and finance; and economic activity groupings - industry, agriculture, forestry, transp...
Statistical Yearbook 2015
The National Statistical Institute (NSI) has the pleasure to present to the attention of national and foreign users of statistical information the 83rd edition of the ‘Statistical Yearbook of the Republic of Bulgaria’ in printed and electronic format.
It provides current statistical information about the demographic, economic and social development of the country for 2010 - 2014 in different territorial and classification aggregations and breakdowns.
According to the Law on Statistics, official source of information in the Republic of Bulgaria is the ...
Education in the Republic of Bulgaria 2015

The National Statistical Institute presents to the attention of users interested in social statistics the newest annual bilingual (Bulgarian and English) electronic publication Education in the Republic of Bulgaria 2015.
The publication contains main data from the five carried out annual comprehensive statistical surveys, which characterizing the activity of educational institutions in Bulgaria for the period from 2010/2011 to 2014/2015 school (academic) years.
The issue presents a broad range of data about kindergartens, education institutions, pupils by differ...
Statistical Reference Book 2015

The National Statistical Institute presents to users of statistical information the annual publication - Statistical Reference Book 2015 in English.
The Statistical Reference Book presents topical information on the demographic processes as well as the economic, social and cultural development of the Republic of Bulgaria for the 2010 - 2014 period.
The publication presents data on main macroeconomic indicators of the national economy - gross domestic product, investments and finance; and economic activity groupings - industry, agriculture, forestry, transport, c...
Statistical Reference Book 2015 (Bulgarian version)

The National Statistical Institute presents to users of statistical information the annual publication - Statistical Reference Book 2015 in Bulgarian.
The Statistical Reference Book presents topical information on the demographic processes as well as the economic, social and cultural development of the Republic of Bulgaria for the 2010 - 2014 period.
The publication presents data on main macroeconomic indicators of the national economy - gross domestic product, investments and finance; and economic activity groupings - industry, agriculture, forestry, transport,...
Statistical Yearbook 2014
The National Statistical Institute (NSI) has the pleasure to present to the attention of national and foreign users of statistical information the 82nd edition of the ‘Statistical Yearbook of the Republic of Bulgaria’ in printed and electronic format.
It provides current statistical information about the demographic, economic and social development of the country for 2009 - 2013 in different territorial and classification aggregations and breakdowns.
According to the Law on Statistics, official source of information in the Republic of Bulgaria is the Nati...
Education in the Republic of Bulgaria 2014

The National Statistical Institute presents to the attention of users interested in social statistics the newest annual bilingual (Bulgarian and English) electronic publication Education in the Republic of Bulgaria 2014.
The publication contains main data from the five carried out annual comprehensive statistical surveys, which characterizing the activity of educational institutions in Bulgaria for the period from 2009/2010 to 2013/2014 school (academic) years.
The issue presents a broad range of data about kindergartens, educa...
Statistical Reference Book 2014
The National Statistical Institute presents to users of statistical information the annual publication - Statistical Reference Book 2014 in English.
The Statistical Reference Book presents topical information on the demographic processes as well as the economic, social and cultural development of the Republic of Bulgaria for the 2009 - 2013 period.
The publication presents data on main macroeconomic indicators of the national economy - gross domestic product, investments and finance; and economic activity groupings - industry, agriculture, forestry, tran...
Statistical Reference Book 2014 (Bulgarian version)
The National Statistical Institute presents to users of statistical information the annual publication - Statistical Reference Book 2014 in Bulgarian.
The Statistical Reference Book presents topical information on the demographic processes as well as the economic, social and cultural development of the Republic of Bulgaria for the 2009 - 2013 period.
The publication presents data on main macroeconomic indicators of the national economy - gross domestic product, investments and finance; and economic activity groupings - industry, agriculture, forestry, tr...
Statistical Yearbook 2013
The National Statistical Institute (NSI) has the pleasure to present to the attention of national and foreign users of statistical information the 81st edition of the ‘Statistical Yearbook of the Republic of Bulgaria’ in printed and electronic format.
It provides current statistical information about the demographic, economic and social development of the country for 2008 - 2012 in different territorial and classification aggregations and breakdowns.
According to the Law on Statistics, official source of information in the Republic of Bulgaria is the Nati...
Education in the Republic of Bulgaria 2013

The National Statistical Institute presents to the attention of users interested in social statistics the newest annual bilingual (Bulgarian&English) electronic publication Education in the Republic of Bulgaria 2013.
The publication contains main data from the five carried out annual comprehensive statistical surveys, which characterizing the activity of educational institutions in Bulgaria for the period from 2008/2009 to 2012/2013 school (academic) years.
The issue presents a broad range of data about kindergartens, education institutions, pupils b...
Statistical Reference Book 2013
The National Statistical Institute presents to users of statistical information the annual publication - Statistical Reference Book 2013 in English.
The Statistical Reference Book presents topical information on the demographic processes as well as the economic, social and cultural development of the Republic of Bulgaria for the 2008 - 2012 period.
The publication presents data on main macroeconomic indicators of the national economy - gross domestic product, investments and finance; and economic activity groupings - industry, agric...
Statistical Reference Book 2013 (Bulgarian version)

The National Statistical Institute presents to users of statistical information the annual publication - Statistical Reference Book 2013 in Bulgarian.
The Statistical Reference Book presents topical information on the demographic processes as well as the economic, social and cultural development of the Republic of Bulgaria for the 2008 - 2012 period.
The publication presents data on main macroeconomic indicators of the national economy - gross domestic product, investments and finance; and economic activity groupings - industry, agr...
Education in the Republic of Bulgaria 2012

The National Statistical Institute presents to the attention of users interested in social statistics the newest annual bilingual (Bulgarian&English) electronic publication Education in the Republic of Bulgaria 2012.
The publication contains main data from the five carried out annual comprehensive statistical surveys, which characterizing the activity of educational institutions in Bulgaria for the period from 2007/2008 to 2011/2012 school (academic) years.
The issue presents a broad range of data about kindergartens, education ...
Statistical Reference Book 2012

The National Statistical Institute presents to users of statistical information the annual publication - Statistical Reference Book 2012 in English.
The Statistical Reference Book represents topical information on the demographic processes as well as the economic, social and cultural development of the Republic of Bulgaria for the 2007 - 2011 period.
The publication presents data on main macroeconomic indicators of the national economy - gross domestic product, investments and finance; and economic activity groupings - industry, agr...
Statistical Reference Book 2012 (Bulgarian version)

The National Statistical Institute presents to users of statistical information the annual publication - Statistical Reference Book 2012 in Bulgarian.
The Statistical Reference Book presents topical information on the demographic processes as well as the economic, social and cultural development of the Republic of Bulgaria for the 2007 - 2011 period.
The publication presents data on main macroeconomic indicators of the national economy - gross domestic product, investments and finance; and economic activity groupings&...
Statistical Yearbook 2011
The National Statistical Institute (NSI) has the pleasure to submit to the attention of national and foreign users of statistical information the 79th edition of the ‘Statistical Yearbook of the Republic of Bulgaria’ in printed and electronic format.
It provides current statistical information about the demographic, economic and social development of the country for the 2005 - 2010 period in different territorial and classification aggregations and breakdowns.
According ...
Education in the Republic of Bulgaria 2011
The National Statistical Institute presents the issued annual bilingual (Bulgarian-English) electronic publication Education in the Republic of Bulgaria 2011 to the attention of users interested in statistical editions containing information in the field of social statistics.
The publication contains general data from the carried out five annual comprehensive statistical surveys, which characterizing the activity of educational institutions in Bulgaria for the 2006 - 2010 period.
The issue presents a broad range of data about kindergartens, e...
Statistical Reference Book 2011
The National Statistical Institute presents to users of statistical information the annual publication - Statistical Reference Book 2011 in English. It is a concise form of the same issue in Bulgarian.
The Statistical Reference Book presents topical information on the demographic processes as well as the economic, social and cultural development of the Republic of Bulgaria for the 2006 - 2010 period.
The publication presents data on main macroeconomic indicators of the national economy - gross domestic product, investments...
Statistical Yearbook 2010
The National Statistical Institute (NSI) has the pleasure to submit to the attention of national and foreign users of statistical information the 78th edition of the ‘Statistical Yearbook of the Republic of Bulgaria’ in printed and electronic format.
It provides current statistical information about the demographic, economic and social development of the country for the 2004 - 2009 period in different territorial and classification aggregations and breakdowns.
Accor...
Statistical Yearbook 2009
The National Statistical Institute (NSI) has the pleasure to submit to the attention of national and foreign users of statistical information the 77th edition of the ‘Statistical Yearbook of the Republic of Bulgaria’ in printed and electronic format. The issue is published in 2010, which marks 130 years since the establishment of a statistical institution in Bulgaria and 100 years since publishing of the first ‘Statistical Yearbook of the Bulgarian Kingdom’ in 1910.
This issue has new design and layout. It provides current statistical information about ...
Statistical Reference Book 2010
The National Statistical Institute presents to users of statistical information the annual publication - Statistical Reference Book 2010 in English. It is a concise form of the same issue in Bulgarian.
The Statistical Reference Book presents topical information on the demographic processes as well as the economic, social and cultural development of the Republic of Bulgaria for the 2005 - 2009 period.
The publication presents data on main macroeconomic indicators of the national economy - gross domestic product, investments...
Adult Education and Training
The National Statistical Institute presents to the users of statistical information the publication Adult Education and Training.
The publication is bilingual (Bulgarian/English) and contains general results from the carried out by NSI inquiry statistical survey (interview) in the households conducted during the period November-December of the year 2007. The survey main target is to determinate the participation rate for persons aged 25 - 64 years in the different forms of the lifelong learning. It is conducted in all member states in the EU by common me...
Education in the Republic of Bulgaria 2010
The National Statistical Institute presents the issued annual bilingual (Bulgarian-English) publication Education in the Republic of Bulgaria 2010 to the attention of users interested in statistical editions containing information in the field of social statistics.
The publication Education in the Republic of Bulgaria 2010 contains general data from the carried out four annual comprehensive statistical surveys, which characterizing the activity of educational institutions in Bulgaria for the 2005 - 2009 period.
The issue presents ...
Bulgaria 2009 - Statistical Panorama
The National Statistical Institute annual publication Bulgaria 2009 - Statistical Panorama (in Bulgarian and summary in English) is available to users of statistical information. In the issue are analyzed the demographic, social and economic development of the Republic of Bulgaria in 2009. Comparisons with the previuous 2008, the basic 2000 and the year 1995 are also made. The publication considers trends and structural changes occurring in the country. Results from pilot Eurostat projects and one-time surveys in the respective fields are being used.
<...Statistical Reference Book 2009
The National Statistical Institute presents to users of statistical information the annual publication - Statistical Reference Book 2009 in English. It is a concise form of the same issue in Bulgarian.
The issue is with a new design and enrich contents. For the first time are included methodological and analytic notes towards all chapters. The information is illustrated with a rich graphic materials.
The Statistical Reference Book presents topical information on the demographic processes as well as the economic, social and cultural ...
Education in the Republic of Bulgaria 2009

The National Statistical Institute presents the issued annual bilingual (Bulgarian-English) publication Education in the Republic of Bulgaria 2009 to the attention of users interested in statistical editions containing information in the field of social statistics.
The publication Education in the Republic of Bulgaria 2009 contains general data from the carried out four annual comprehensive statistical surveys, which characterizing the activity of educational institutions in Bulgaria for the 2004 - 2008 period.
The issue presents ...
Bulgaria 2008 - Statistical Panorama
The National Statistical Institute annual publication Bulgaria 2008 - Statistical Panorama (in Bulgarian and summary in English) is available to users of statistical information. In the issue are analyzed the demographic, social and economic development of the Republic of Bulgaria in 2008. Comparisons with the preceding years are made and the tendencies of the development and the current structural changes are considered.
The publication is formed topically by sections, as each section contains short analytical text with charts and tables. The mai...
Statistical Yearbook 2008
The National Statistical Institute has the pleasure to submit to the attention of national and foreign users of statistical information the 76th edition of the Statistical Yearbook of the Republic of Bulgaria 2008. It provides topical statistical information on the demographic, economic and social development of the country for the 2002 - 2007 period in different territorial and classification aggregations and breakdowns.
According to the Law on Statistics, official source of information in the Republic of Bulgaria is the National Statistical System, wh...
Statistical Reference Book of the Republic of Bulgaria 2008
The National Statistical Institute presents to users of statistical information one of its main publications - Statistical Reference Book of the Republic of Bulgaria 2008 in English. It is a concise form of the same issue in Bulgarian.
The Statistical Reference Book presents topical information on the demographic processes as well as the economic, social and cultural development of the Republic of Bulgaria for the 2004 - 2007 period.
The publication presents data on main macroeconomic indicators of the national economy - gross dom...
Continuing Vocational Training in Еnterprises in 2005

The National Statistical Institute informs its customers that the publication Continuing Vocational Training in Еnterprises in 2005 is already available.
The main results from the carried out in 2006 sample survey on vocational training (initial and continuing) organized by the enterprises in 2005 for their employed are presented in the publication.
The publication contains four sections:
- Methodological notes, in which the main goal and tasks, the definitions and used classifications, the object and the scope of the survey, the ...
Classification of Fields of Education and Training 2008
The National Statistical Institute informs the users of statistical information that the publication 'Classification of Fields of Education and Training 2008' is already available (in Bulgarian only). This classification is used for the purpose of classifying programmes according to fields of education and training.
The publication contains an introduction, structure and explanatory notes. The classifications' structure has three hierarchical levels - first level for 'broad fields', second level 'narrow fields' and third level 'detailed fields'. There are 9 b...


